# Palau model: minimal deterministic variant with 6 fully filled identical sites
# Finding the optimal catch for different combinations of use and fishing intensity at certain values of reproduction rate (r) and mobility (m) of fish between sites
library(binhf) # A library that allows to "shift" vectors with the shift() function
library(plot3D) # Extension for creating three-dimensional graphs
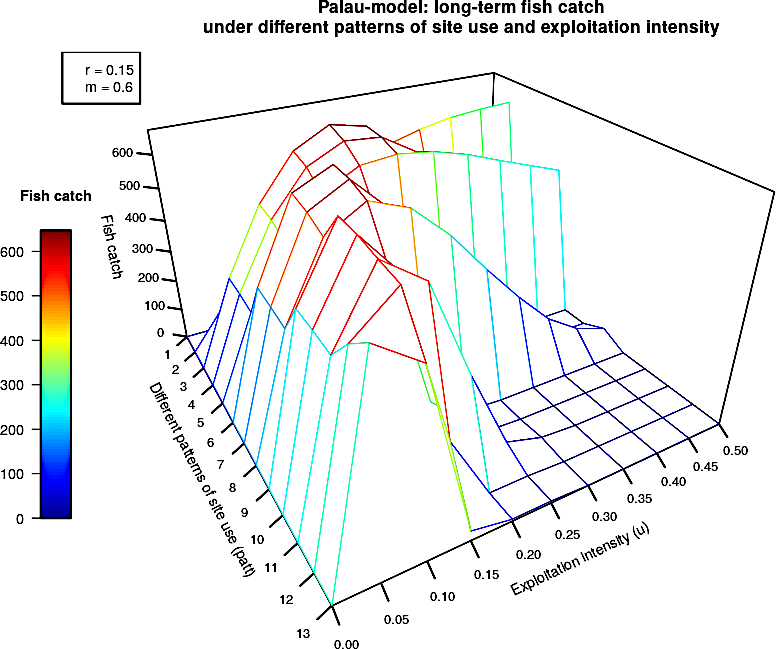
r <- 0.15 # The Malthus parameter, a measure of the reproduction rate
m <- 0.6 # The measure of fish mobility (speed of equalization of their numbers between neighboring sites)
t <- 200 # Number of simulation cycles (years)
K <- rep(3000, 6) # A vector with the Ferhulst parameter (medium environmental capacities at the sites)
Palau <- function(patt, u){ # Creating a custom function "Palau"
  Catches <- 1:t # Vector where the catches of each year will be collected
  Use <- switch(patt, # Selection of the pattern of sites use (0 - areas where there is no catch, 1 - with catch)
          c(0, 0, 0, 0, 0, 0),  # patt=1: lack of exploitation
          c(1, 0, 0, 0, 0, 0),  # patt=2: operation of only one site
          c(1, 0, 0, 1, 0, 0),  # patt=3: operation of two sites opposite in location
          c(1, 0, 1, 0, 0, 0),  # patt=4: operation of two sites separated by one that is not used
          c(1, 1, 0, 0, 0, 0),  # patt=5: operation of two adjacent sites
          c(1, 0, 1, 0, 1, 0),  # patt=6: operation of three sites separated by one that is not used
          c(1, 1, 0, 1, 0, 0),  # patt=7: operation of two adjacent and one remote site
          c(1, 1, 1, 0, 0, 0),  # patt=8: operation of three sites next to each other
          c(1, 1, 0, 1, 1, 0),  # patt=9: operation of two groups of two adjacent sites
          c(1, 1, 1, 0, 1, 0),  # patt=10: reservation of two sites separated by one that is used
          c(1, 1, 1, 1, 0, 0),  # patt=11: reservation of two adjacent sites
          c(1, 1, 1, 1, 1, 0),  # patt=12: reservation of one site
          c(1, 1, 1, 1, 1, 1) ) # patt=13: exploitation of all areas
  Al_N <- K # Alpha-numbers of fish at the beginning of each cycle. Before the start of the simulation, the number at all sites is equal to the capacity (K)
  for (i in 1:t){ # The main cycle that takes place for each year inside the "Palau" function
    Be_N <- ifelse(Al_N < 4, 0, round(Al_N + r * Al_N * (K-Al_N) / K )) # Beta-number of fish after reproduction. If the number is below a certain level (4 individuals), it should be equal to 0; if more, it grows according to the logistic model
    Ga_N <- round(K * (Be_N + shift(Be_N, places=-1)) / (K + shift(K, places=-1)), 0) # Gamma-numbers of fish that would be achieved in the case of a complete redistribution of individuals between sites
    De_N <- round(m * (Be_N - Ga_N), 0) # Delta-numbers of fish moving from site to site
    Ep_N <- Be_N + shift(De_N, places=1) - De_N # Epsilon-numbers: the number of fish after moving
    Dz_N <- round(Ep_N * Use * u, 0) ; Catches[i] <- sum(Dz_N) # Zeta-numbers: catch
    Om_N <- Ep_N - Dz_N # Omega-numbers: what's left after the catch
    Al_N <- Om_N  # The end of each cycle determines the beginning of the next cycle
    } # The end of the main cycle
  Stab_Use <- sum(Catches[(t-19):t]) / 20 # Stable catch (over the last 20 years)
  Stab_Use } # End of "Palau" function description
set_patt <- seq(1, 13, length = 13) # A vector that iterates over all site use patterns
set_u <- seq(0, 0.5, length = 11) # A vector that iterates over different fishing intensities, from no (0) to full fishing (1)
Profit <- matrix(NA, nrow = length(set_patt), ncol = length(set_u), dimnames = list(set_patt, set_u)) # A table specifying all combinations of patterns and catch levels
for (patt in set_patt){ # The beginning of a cycle that iterates through different patterns of site use (patt)
  for (u in set_u){ # The beginning of the cycle that goes through the various levels of exploitation of the selected sites (u)
    Profit[which(set_patt==patt), which(set_u==u)] <- Palau(patt, u) }} # Catch record for selected patt and u
Profit
##    0 0.05 0.1   0.15    0.2   0.25   0.3 0.35    0.4   0.45    0.5
## 1  0    0   0   0.00   0.00   0.00   0.0    0   0.00   0.00   0.00
## 2  0  139 257 354.00 430.00 490.00 533.0  562 582.00 591.00 596.00
## 3  0  270 474 608.00 664.00 640.00 532.0  342 115.90  20.00  10.00
## 4  0  268 466 594.00 646.00 637.00 572.0  466 340.00 210.65 108.15
## 5  0  260 442 552.00 608.00 618.00 604.0  574 534.00 496.00 458.00
## 6  0  384 615 666.00 501.00 130.80  21.0    6   6.00   0.00   0.00
## 7  0  378 603 662.00 553.00 298.95  53.7    8   8.00   0.00   0.00
## 8  0  370 579 643.00 599.00 498.00 370.0  250 142.35  71.90  34.45
## 9  0  476 670 524.00  86.00   8.00   0.0    0   0.00   0.00   0.00
## 10 0  475 668 535.00 120.15   6.00   0.0    0   0.00   0.00   0.00
## 11 0  469 656 574.00 292.00  42.10   8.0    0   0.00   0.00   0.00
## 12 0  553 647 216.75   6.00   6.00   0.0    0   0.00   0.00   0.00
## 13 0  612 528  30.00   6.00   6.00   0.0    0   0.00   0.00   0.00
persp3D(z = Profit, x = set_patt, y = set_u, theta = 60, phi = 30,
        zlab = "\nFish catch", xlab = "Different patterns of site use (patt)", ylab = "Exploitation intensity (u)",
        expand = 0.6, main = "Palau-model: long-term fish catch\nunder different patterns of site use and exploitation intensity", facets = FALSE, scale = TRUE,  ticktype = "detailed",nticks = 9,
        cex.axis=0.9,
        clab = "\nFish catch", colkey = list(side = 2, length = 0.5))
legend("topleft", c(paste("r =",  r), paste("m =", m))