

Vinogradova et al. (2013) Study of Fluctuating Asymmetry in European Perch
Article based on fieldwork from the 2012 summer practice by Vinogradova K. P., Sakun Yu. V., Belousova K. M., Goncharov G. L., Shabanov D. A. Study of fluctuating asymmetry of European perch (Perca fluviatilis L., 1758) // Biology and Valeology, 2012. - Issue 14. - P. 9-17
Study of Fluctuating Asymmetry in European Perch (Perca fluviatilis L., 1758)
Vinogradova K. P. 1, Sakun Yu. V. 1, Belousova K. M. 1, Goncharov G. L. 2, Shabanov D. A. 1
1 V. N. Karazin Kharkiv National University;
2 Homilshanski Lisy National Nature Park
256 European perch (Perca fluviatilis L., 1758) were captured at shallows of the Seversky Donets River in Zmiiv district of Kharkiv Oblast. These perch belonged to three age groups (0+, 1+, and 2+). The number of scales along the lateral line, as well as the number of rays in the pectoral and pelvic fins, were determined on both sides of each fish. It is shown that these characters can serve as a measure of fluctuating asymmetry. The level of fluctuating asymmetry was found to decrease with age. The lowest asymmetry is characteristic of individuals of average size for their age group, i.e., individuals with an average growth rate. These results are interpreted as manifestations of stabilizing selection.
Keywords: Perca fluviatilis, fluctuating asymmetry, growth rate, stabilizing selection.
Vinogradova K. P., Sakun Yu. V., Belousova K. M., Goncharov G. L., Shabanov D. A. The study of fluctuating asymmetry of European perch (Perca fluviatilis L., 1758). 256 river perch (Perca fluviatilis L., 1758) was captured at the shallows on the Seversky Donets River in the Zmijivskij rajon (Kharkiv oblast). These perches belonged to the three age groups (0 +, 1 + and 2 +). Number of scales was count on both sides of each fish along the lateral line, number of rays in the pectoral and pelvic fins also was count. It is shown that these features are largely affected by fluctuating asymmetry. Found that the level of fluctuating asymmetry decreases with age. Lowest asymmetry is typical for individuals with an average size for the age group, ie individuals with an average growth rate. These results are considered as a manifestation of stabilizing selection.
Keywords: Perca fluviatilis, fluctuating asymmetry, growth rate, stabilizing selection.
Vinogradova K. P., Sakun Yu. V., Belousova K. M., Goncharov G. L., Shabanov D. A. Study of fluctuating asymmetry of European perch (Perca fluviatilis L., 1758). 256 European perch (Perca fluviatilis L., 1758) were captured at shallows of the Seversky Donets River in Zmiiv district of Kharkiv Oblast. These perch belonged to three age groups (0+, 1+, and 2+). The number of scales along the lateral line and the number of rays in the pectoral and pelvic fins were determined on both sides of each fish. It is shown that these characters can serve as a measure of fluctuating asymmetry. The level of fluctuating asymmetry was found to decrease with age. The lowest asymmetry is characteristic of individuals of average size for their age group, i.e., individuals with an average growth rate. These results are interpreted as manifestations of stabilizing selection.
Keywords: Perca fluviatilis, fluctuating asymmetry, growth rate, stabilizing selection.
Introduction. The composition and characteristics of samples from natural populations collected during field biological studies are influenced by a whole complex of processes whose effects are hidden from the observer. Thus, the morphological characteristics of animals are a result of ontogenesis - a self-organizing process affected by both the internal developmental program and external influences. The composition of natural populations is shaped by natural selection, which may depend on various factors and may act in different directions.
Different ontogenetic processes are regulated to varying degrees. The stability of these processes is difficult to observe directly, but can be assessed indirectly. In any given case, we can observe a particular outcome of ontogenesis, but cannot determine with what probability other outcomes might have been realized. In most cases, we cannot monitor the development of a set of clonal organisms under identical environmental conditions. However, in many cases, developmental stability can be assessed by studying not inter-individual but intra-individual variation.
Fluctuating asymmetry refers to random, non-directional deviations from bilateral symmetry in organisms, which can be regarded as consequences of "ontogenetic noise" - the incomplete capacity of organisms to develop along strictly defined pathways [3; 5]. Since fluctuating asymmetry has a stochastic nature, it can be studied not at the level of individual specimens, but only by examining groups of individuals in population-level analyses.
Numerous studies have demonstrated that the level of fluctuating asymmetry increases under adverse developmental conditions, in hybrid organisms with an unbalanced genotype, and so forth [2]. According to the classification of asymmetry types proposed by L. Van Valen [9], one should distinguish between directional and fluctuating asymmetry, as well as antisymmetry. Developmental stability can be assessed only by means of fluctuating asymmetry.
Of particular interest is the study of fluctuating asymmetry in natural samples composed of individuals of different ages.
Material and Methods. The present study was carried out as a research training exercise by second-year students of the Biology Faculty of V. N. Karazin Kharkiv National University during a field practical course. A sample of 256 individuals of European perch (Perca fluviatilis Linnaeus, 1758), caught on 12, 13, and 23 June 2012 using a seine net with a mesh size of 6 mm at three sandy shallows of the Seversky Donets River near the biological field station of V. N. Karazin Kharkiv National University (Haidary village, Zmiiv district, Kharkiv Oblast), was studied within the catch quota granted to Homilshanski Lisy National Nature Park.
For each individual, the standard body length L (in mm) was measured using a caliper, and under a binocular microscope the number of scales (S) along the lateral line on the right (Sr) and left (Sl) sides of the body, as well as the number of rays in the pectoral (P) and pelvic (V) fins on the right and left sides (Pr and Pl; Vr and Vl, respectively), were counted.
The examined fish were divided into size groups by body length. Scale samples from representatives of each age group were examined under a binocular microscope following standard methodology [4], with the number of slow-growth zones (rings of closely spaced sclerites) corresponding to overwintering periods being counted.
Statistical analysis of asymmetry measurements for the studied characters was performed according to the procedure described by D. V. Gelashvili et al. [1] using Statistica 7.0 (StatSoft). For each individual, asymmetry values for the studied characters were calculated: DS=Sr-Sl, DP=Pr-Pl, DV=Vr-Vl, as well as absolute asymmetry values for the same characters: AS=|Sr-Sl|, AP=|Pr-Pl|, AV=|Vr-Vl|. In addition, a composite asymmetry index was calculated for each individual: Sigma(A)= AS+AP+AV.
Results and Discussion.
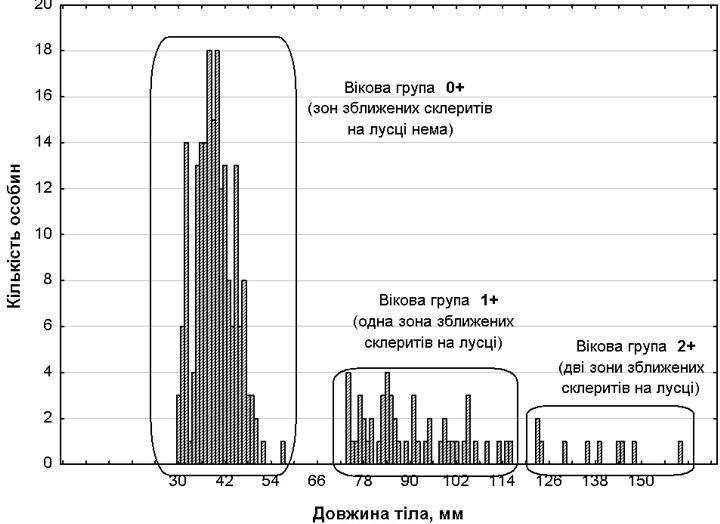
1. Correspondence between size and age groups. The quantitative, size, and age composition of the sampled individuals is shown in Table 1 and Fig. 1. As scale analysis demonstrated, the size groups correspond to age groups: individuals of size group I have no slow-growth zones corresponding to overwintering, those of size group II have one such zone, and those of size group III have two zones. As can be seen (Table 1; Fig. 1), the size groups are separated by distinct gaps and are well distinguished from one another.
Table 1. Size (age) groups of examined Perca fluviatilis individuals
|
Size groups |
Women |
Body length, mm: mean (minimum - maximum) |
Number of individuals |
|
I |
0+ |
39,5 (30 – 57) |
196 |
|
II |
1+ |
89,6 (74 – 116) |
51 |
|
III |
2+ |
137,2 (123 – 160) |
10 |
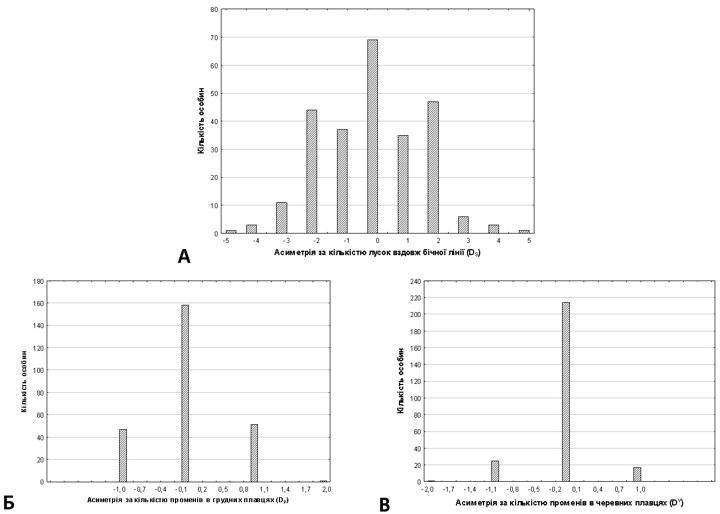
![Fig. 3. The epigenetic landscape according to C. H. Waddington [10]. Ontogenesis is compared to a ball rolling down a surface of complex relief. More probable states of the developing system correspond to the valleys of the surface. Accepting thi](https://s3.prozo.re/batrachos/images/fa3_1Wk4Jg6.original.jpg)
|
L (body length) |
AS |
AP |
AV |
|
|
Sr+Sl Sr+Sl (total scale count on both sides) |
rS=0,23 p=0,0003 |
rS=–0,08 p=0,16 |
||
|
Pr+Pl Pr+Pl (total ray count in pectoral fins) |
rS=0,39 p=0,0000 |
rS=–0,06 p=0,27 |
||
|
Vr+Vl Vr+Vl (total ray count in pelvic fins) |
rS=0,06 p=0,33 |
rS=–0,52 p=0,0000 |
||
|
AS AS (absolute asymmetry in scale count) |
rS=–0,36 p=0,0000 |
— |
rS=–0,07 p=0,21 |
rS=0,14 p=0,027 |
|
AP AP (absolute asymmetry in pectoral fin ray count) |
rS=0,04 p=0,52 |
— |
rS=0,20 p=0,001 |
|
|
AV AV (absolute asymmetry in pelvic fin ray count) |
rS=–0,09 p=0,14 |
— |
Based on the data presented in Table 2, the following conclusions can be drawn. All used measures of asymmetry demonstrate a negative correlation with the number of counted structures; among these relationships, only the one concerning the number of rays in the pectoral fins is significant. With increasing linear dimensions, a significant decrease in asymmetry in the number of scales is recorded; the relationship with the other two parameters is insignificant. With increasing linear dimensions, the number of counted structures increases (for the number of rays in the pectoral fins, this relationship is insignificant). Asymmetry in the number of rays in the pectoral fins is significantly related to asymmetry in the number of scales and the number of rays in the pectoral fins; the relationship between the latter two quantities is insignificant. Size-dependency of asymmetry measures (in cases where asymmetry is related to the number of structures studied) can lead to the fact that individuals with a larger number of such structures will be mistakenly considered as individuals with less stable ontogenesis. In cases where the studied quantities exhibit size-dependency, D. V. Gelashvili et al. [1] recommend normalization (relating the measure of asymmetry to the number of counted structures). It is more difficult to interpret the negative correlation of asymmetry with the number of meristic structures. The decrease in the level of asymmetry with an increase in the number of counted structures is not purely an arithmetic phenomenon; this effect can only be explained by the action of a factor that reduces asymmetry when meristic structures increase. Furthermore, the trait for which a negative size-dependency is recorded is significantly related to two other measures of asymmetry. Considering these circumstances, we used absolute measures of asymmetry and their sum for further analysis: Σ(A) = A S + A P + A V. 4. Relationship between asymmetry and age and growth rate of individuals. Our study investigates three age groups of P. fluviatilis. However, these groups are not homogeneous (Fig. 1): within each group, individuals with relatively small, medium, or large sizes can be identified. Spawning of P. fluviatilis is single and occurs in a specific water body, mainly during 9-13 days, sometimes up to a month [8]. In recent years, in the absence of significant floods and with a rapid increase in water temperature in the spring, mass perch spawning in the channel section of the Seversky Donets River within the National Nature Park "Homilshanski Lesy" occurs mainly over 7-10 days. If the age of these individuals is almost the same, this size difference is related to the growth rate. Based on this characteristic, we divided each age group into three subgroups of similar numbers (Table 3). Deviations from equal subgroup numbers are due to the fact that all individuals of the same body length were assigned to the same subgroup. Table 3. Subgroups identified by growth rate within each size-age group of P. fluviatilis.
|
Size-age groups and their sample sizes (n) |
Subgroups by growth rate: n individuals; (min-max), mm |
||
|
Slow-growing |
Intermediate growth rate |
Fast-growing |
|
|
I (0+); n=195 |
n=68; (30–37) |
n=63; (38–41) |
n=64; (42–57) |
|
II (1+); n=51 |
n=15; (74–82) |
n=19; (83–94) |
n=17; (95–116) |
|
III (2+); n=10 |
n=4; (123–130) |
n=2; (136–139) |
n=4; (144–160) |
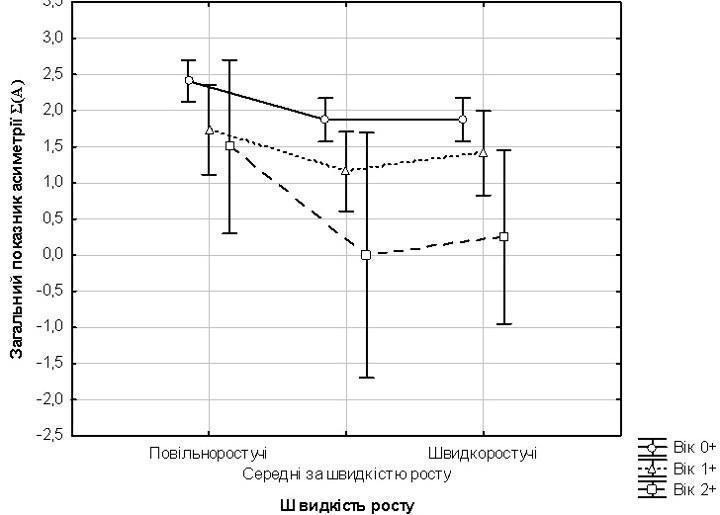
We performed a two-way analysis of variance, where age of P. fluviatilis and their growth rate were considered as factors, and the total asymmetry index Σ(A) was considered as the dependent variable. The results of this analysis are shown in Table 4 and Fig. 4. Both the effect of age and the effect of growth rate turned out to be significant, but the effect of age is more important. How can we explain the fact that the level of asymmetry in P. fluviatilis samples decreases with age? Two hypotheses can be proposed. The first (correction hypothesis) suggests that over time, certain individuals may become more symmetrical. According to the second (stabilizing selection hypothesis), asymmetrical individuals have a higher chance of dying, and therefore their proportion in a generation decreases over time. The correction hypothesis seems unlikely to us, if only because the processes it assumes have not been previously recorded, as far as we know. The hypothesis of stabilizing selection is supported by the fact that the lowest level of asymmetry is characteristic of individuals with an average growth rate, and the highest is in the smallest individuals within their size groups. It should be noted that stabilizing selection is the cause of the stability of normal development [7]. Table 4. Results of variance analysis
|
Effect |
SS Sum of squares |
df Degrees of freedom |
MS Mean square |
F Kriterii Fishera |
p Significance |
|
Women |
31,01 |
2 |
15,51 |
10,4 |
0,00005 |
|
Growth rate |
10,05 |
2 |
5,03 |
3,38 |
0,036 |
|
Age x Growth rate interaction |
2,10 |
4 |
0,53 |
0,35 |
0,84 |
|
Error |
367,78 |
247 |
1,49 |
Based on the data in Table 2, the following conclusions can be drawn. All asymmetry measures used show a negative correlation with the count of the structures examined; of these associations, only that involving the number of pelvic fin rays is statistically significant. With increasing body length, a significant decrease in lateral-line scale asymmetry is recorded; the association with the other two parameters is non-significant. With increasing body size, the number of counted structures increases (for the number of pelvic fin rays this association is non-significant). Pelvic fin ray asymmetry is significantly associated with scale count asymmetry and pectoral fin ray asymmetry; the association between the latter two is non-significant.
Size-dependence of asymmetry measures (the case where asymmetry is associated with the number of structures examined) may lead to individuals with a greater number of such structures being erroneously regarded as having less stable ontogenesis. In cases where the studied variables exhibit size-dependence, D. V. Gelashvili et al. [1] recommend normalization (expressing the asymmetry measure relative to the number of counted structures).
The negative correlation between asymmetry and the number of meristic structures is more difficult to interpret. The decrease in asymmetry level with an increasing count of enumerated structures is not a purely arithmetic phenomenon; this effect can only be explained by the action of some factor that reduces asymmetry as the number of meristic structures increases. Furthermore, the character for which a negative size-dependence was recorded is significantly associated with two other asymmetry measures. In view of these circumstances, for the subsequent analysis we used absolute asymmetry measures and their sum: Sigma(A)= AS+AP+AV.
4. Association of asymmetry with age and individual growth rate. In the present study, three age groups of P. fluviatilis are examined. However, these groups are not homogeneous (Fig. 1): within each, individuals of relatively small, intermediate, or large size can be distinguished. Spawning in P. fluviatilis is a single event and occurs in a given water body predominantly over a period of 9-13 days, sometimes up to one month [8]. In recent years, in the absence of major spring floods and with a sufficiently rapid rise in water temperature during spring, the mass spawning of perch on the channel section of the Seversky Donets within Homilshanski Lisy National Nature Park has predominantly taken place over 7-10 days. If the age of these individuals is nearly identical, the size differences are associated with growth rate. On this basis, each age group was subdivided into three roughly equal subgroups (Table 3). Deviations from equal subgroup sizes are due to the fact that all individuals of identical body length were assigned to a single subgroup.
Table 3. Subgroups defined by growth rate within each size-age group of P. fluviatilis
A two-way analysis of variance was performed in which the factors were the age of P. fluviatilis and their growth rate, while the variable whose variation depended on these factors was the composite asymmetry index Sigma(A). The results of this analysis are shown in Table 4 and Fig. 4.
Both the effect of age and the effect of growth rate proved significant, but the effect of age was more important. How can one explain the observation that the level of asymmetry in samples of P. fluviatilis decreases with age?
Two hypotheses may be advanced. The first (the correction hypothesis) proposes that over time certain individuals may become more symmetric. According to the second (the stabilizing selection hypothesis), more asymmetric individuals have a higher probability of dying, so their proportion within a cohort decreases over time. The correction hypothesis seems unlikely, at least because the processes it presupposes have not, to our knowledge, been previously documented. The stabilizing selection hypothesis is also supported by the finding that the lowest level of asymmetry is characteristic of individuals with an intermediate growth rate, while the highest level is found in the smallest individuals within their size groups. It should be noted that stabilizing selection is itself the cause of the stability of normal development [7].
Table 4. Results of analysis of variance
Gelashvili D. B., Yakimov V. N., Loginov V. V., Eplanova G. V. Statistical analysis of fluctuating asymmetry of bilateral characters in the racerunner lizard Eremias arguta // Current Problems in Herpetology and Toxinology: Collected Scientific Papers. Issue 7. - Tolyatti, 2004. - P. 45-59.
Gavrikov D. E. Asymmetry of bilateral characters in vertebrate animals // Bulletin of the ESCSC SB RAMS, 2007. - No. 2. - P. 26-28.
Zakharov V. M. Asymmetry of Animals. Moscow: Nauka, 1987. - 216 p.
Pravdin I. F. A Guide to the Study of Fishes. Moscow: Pishchevaya promyshlennost, 1966. - 374 p.
Romanov N. S. Fluctuating asymmetry in hatchery-reared and naturally spawned salmonids // Readings in Memory of V. Ya. Levanidov. Vladivostok: 2001. - P. 328-330.
Khalafyan A. A. Statistica 6. Statistical Data Analysis. Moscow: Binom-Press LLC, 2007. - 512 p.
Shishkin M. A. Individual development and evolutionary theory // Evolution and Biocoenotic Crises. Moscow: Nauka, 1987. - P. 76-124.
Shcherbukha A. Ya. Fauna of Ukraine. Vol. 8. Fishes. Issue 4. Perciformes (perch-like, wrasse-like, dragonet-like, blenny-like, sand eel-like, lyrefish-like, mackerel-like). Kyiv: Naukova dumka, 1982. - 384 p.
Van Valen L. Study of fluctuating asymmetry / L. Van Valen // Evolution. - 1962. - Vol. 16, No. 2. - P. 125-146.
Waddington C. H. The Strategy of the Genes: a Discussion on Some Aspects of Theoretical Biology. London: Allen and Unwin, 1957. - 262 p.