Biology Olympiad - 2016
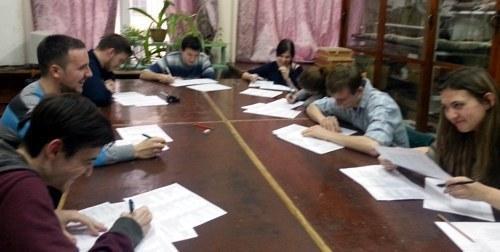
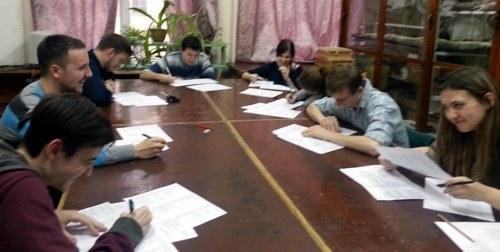
The faculty stage of the student biology Olympiad has been held. Its results — here
{ "translated_text": " Another faculty stage of the student biology Olympiad was held.
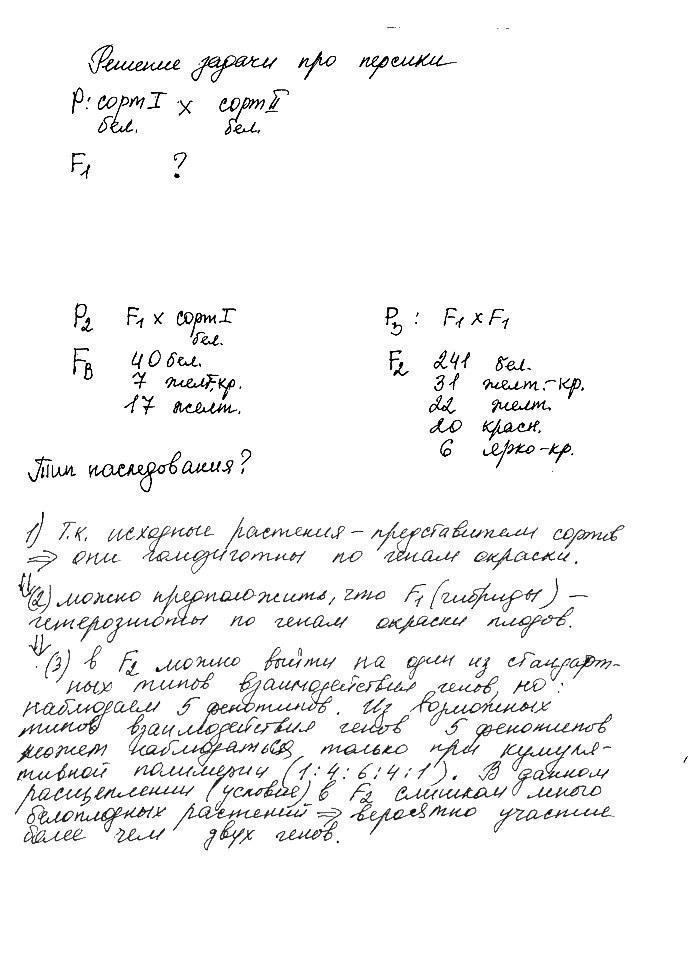
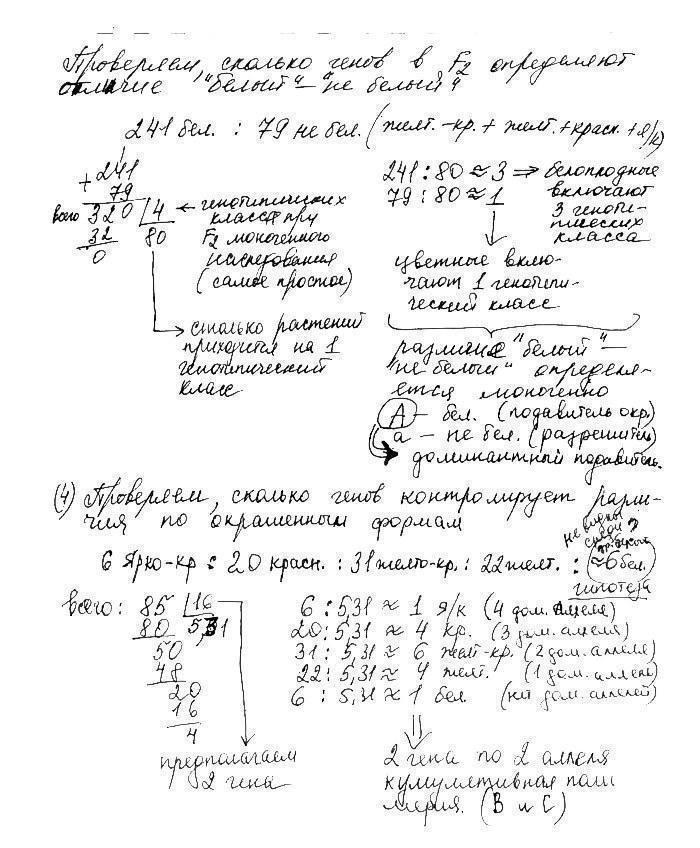
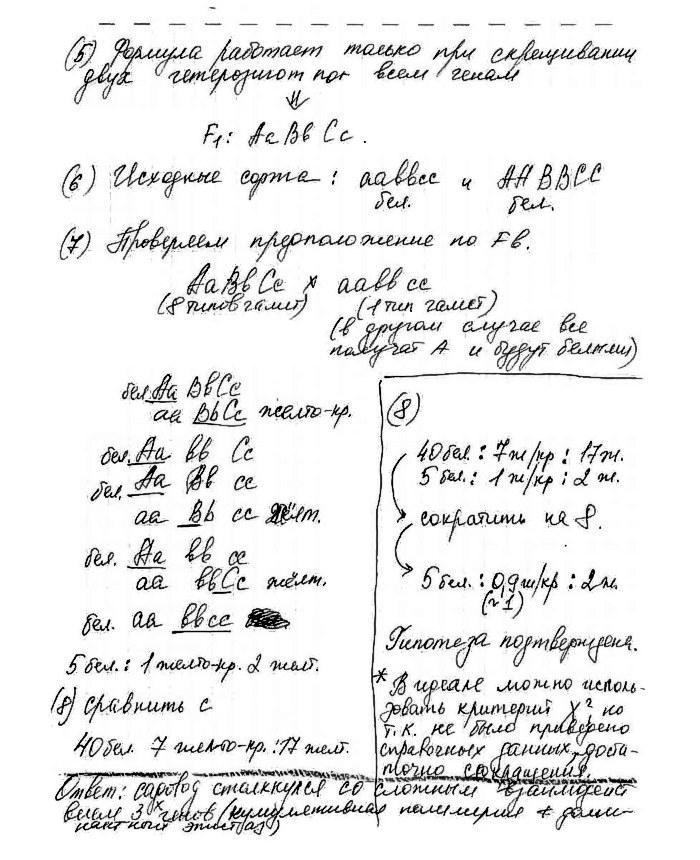
Below is the final table. Congratulations to the winners who will go to Zhytomyr — Mykhailo Shlakhtar and Mykola Drogvalenko! Thank you to all participants and all task authors! Scores were calculated so that for each question the weakest answer receives 0 points, and the strongest answer receives the maximum number of points allocated for the question. Consequently, a final score of 0 corresponds to the participant who performed the worst on all questions, and 100 corresponds to the participant who achieved the best result on all questions among all participants. How this was computed can be seen from the Excel table screenshot shown above. The cursor is on cell I4, and the formula bar shows how the score was recalculated (24 is the minimum \"raw\" score obtained on the test, and 46 is the maximum). This calculation method allows any numerical scales to be used during grading; the normalization is based not on the maximum possible score, but on the difference between the best and worst answer for each task. The tasks were as follows. The most weighty for the final result was a test consisting of 62 items (45 minutes were allotted for its completion to assess rapid answering ability). Partially it consisted of items from a demonstration test for admission to the master’s program (my colleagues managed to prepare this version, but had not yet posted it; thanks to the courtesy of O. V. Taglina we were able to use it in the Olympiad). The second part of the test comprised items by S. N. Fedosova on human anatomy (they were more difficult). In the left part of the table the number of correct answers (out of 62) given by each participant is indicated. I will not reproduce the test items here. Task No. 1 (author — N. Ye. Volkova) Once an amateur gardener crossed two peach varieties of different cultivars, both of which produced white fruits. For three years he cared for the hybrids, and in the spring of the fourth year, when the plants blossomed, he re‑pollinated part of the hybrid F1 flowers with pollen from one parent; the other part of the flowers self‑pollinated. At the end of summer all hybrid plants yielded white fruits. The gardener saved the stones from the fruits that developed from the re‑pollinated and self‑pollinated flowers. In spring he planted them in soil and three years later in autumn obtained the following. From the F2 plants 241 produced white peaches, 31 yellow‑red, 22 yellow, 20 red, 6 bright red. From the plants obtained by the reciprocal cross 40 produced white peaches, 7 yellow‑red and 17 yellow. The gardener was surprised how offspring with different coloration appeared from plants with white fruits. Explain to the amateur gardener which genetic law he encountered during the crosses, and how, based on his results, fruit coloration is inherited in peaches. Task No. 2 (author — K. V. Kot) Calculate the melting temperature (Tm) and the number of hydrogen bonds in a DNA‑A molecule, given that the total molecular mass of thymidine nucleotides in it equals 690 000 atomic mass units, and the length of the double‑stranded DNA molecule is 1.3 µm. For reference: DNA melting temperature is linearly dependent on GC‑pair content, described by: Tm = 69.3 + 0.41 × Z, where Z is the GC‑pair content (in %). The length of one turn of A‑DNA is 2.86 nm; one turn contains 11 nucleotide pairs. The average molecular mass of one nucleotide is 8.023 times greater than the sum of the relative atomic masses of the four chemical elements that form the peptide bond. Task No. 3 (author — Ye. O. Kiosia) Currently there are four main hypotheses explaining the existence of black and white stripes in zebras: 1) individual identification within a herd; 2) protection from large predators; 3) protection from blood‑sucking insects; 4) thermoregulation. What studies would you conduct to test these hypotheses and reach a final conclusion about the purpose of zebra striping? Task No. 4 (author — D. A. Shabanov) Schematically draw (so that your illustration reflects body regions, limbs, major external organs, etc.) the following animals: — southern Russian tarantula, Lycosa singoriensis; — green bush‑cricket, Tettigonia viridissima; — river perch, Perca fluviatilis; — Black Sea bottlenose dolphin, Tursiops truncatus. The last task caused groans among the biochemistry participants. Since it can be considered less “serious”, I halved its points, “reallocating” the freed 10 points to the test. Each task was checked by its author (the test was checked by me according to the answer key provided by the task authors). Author’s scoring criteria for Task 1 10 – the problem is solved correctly, accompanied by explanations that fully reveal the logic of analysis; neatly formatted; 9 – solved correctly, with some explanations that partially reveal the logic of analysis; 8 – solved overall, correct answers obtained but not for all questions; accompanied by fragmentary explanations hinting at the logic of analysis; 7 – solved overall, correct answers obtained but not for all questions; no explanations; 6 – solved partially, correct answers for some questions; 5 – not solved, a brief statement of the problem is present; somewhat formulated explanations related to the solution and hinting at correct reasoning; 4 – not solved, brief problem statement present; vague explanations related to the solution, genotype labels; 3 – not solved, brief problem statement present; isolated notes related to the solution; 2 – not solved, brief problem statement present; 1 – incomplete problem statement present; 0 – a blank sheet of paper. Author’s scoring criteria for Task 2 The biochemistry/molecular biology task of finding the melting temperature and the number of hydrogen bonds in a DNA molecule was intended to assess the ability to use the given data, reference material, as well as knowledge acquired already in the first year of university. Initially it was not planned to check the correctness of calculations (since the working numbers are large and students have no calculator), but only the logic of the solution and the sequence of steps. However, because some participants gave answers very close to the exact ones, this was also taken into account. Maximum points – 10. Distributed as follows: — overall understanding of the task – up to 2 points; — use of all available data – up to 2 points; — presence of explanations (even minimal) – up to 2 points; — answer for melting temperature – 2 points for an exact answer, 1 for an approximate one; — answer for hydrogen bonds – 2 points for an exact answer, 1 for an approximate one. Solution: 1) Convert DNA length from µm to nm: lDNA = 1.3 µm = 1.3 × 10³ nm = 1300 nm. 2) Knowing that one turn of A‑DNA is 2.86 nm and contains 11 nucleotide pairs, determine the length of one nucleotide pair: l1 pair = 2.86/11 = 0.26 nm. 3) Number of nucleotide pairs in the DNA molecule: Npair = lDNA / l1 pair = 1300 nm / 0.26 nm = 5 000 pairs. 4) Total number of nucleotides: Nnt = Npair × 2 = 5 000 × 2 = 10 000 nucleotides. 5) Determine the average molecular mass of one nucleotide.
The peptide group contains 4 atoms – C, N, O, H, with relative atomic masses 12, 14, 16 and 1 respectively.
If the average molecular mass of a nucleotide is 8.023 times the sum of these masses, then Mn = 8.023 × (12+14+16+1) = 8.023 × 43 = 345.
6) Total number of thymidine nucleotides (T) in the DNA: NT = MDNA / Mn = 690 000 / 345 = 2 000 nucleotides. 7) By Chargaff’s rule A = T, G = C. Thus A = 2 000 nucleotides. A+T = 4 000 nucleotides. G+C = 100 % – (A+T) = 10 000 – 4 000 = 6 000 nucleotides. 8) %GC pairs in DNA: GC = 6 000 / 10 000 = 60 %. 9) Melting temperature: Tm = 69.3 + 0.41 × 60 = 93.9 °C. 10) Hydrogen bonds: A‑T pairs are held by 2 H‑bonds, G‑C pairs by 3 H‑bonds. Thus A‑T bonds = 4 000 × 2 = 8 000, G‑C bonds = 6 000 × 3 = 18 000. Total = 8 000 + 18 000 = 26 000 H‑bonds. Author’s scoring criteria for Task 3 The zebra question pertained less to zoology or evolutionary biology than to the methodology of science. No single correct answer was expected. Any reasonably described research schemes – observations, experiments or modeling studies – were welcomed, provided they allowed a justified choice among the proposed hypotheses. Realism of the proposed ideas in terms of practical implementation was also considered. For example, “re‑color part of a zebra herd as antelopes and see how quickly lions eat them” or “simulate a savanna with all environmental factors” would be extremely difficult. Counting “how many times a melanistic zebra is bitten by flies” is also inconvenient. Zebras are not laboratory mice, and the arsenal of available methods for them is much more limited. Moreover, given the large number of plausible hypotheses, it was preferable not to seek further confirmations of any of them, but to try to falsify them. It is noteworthy that the purpose of zebra stripes remains unresolved despite a long research history. Even Charles Darwin and A. R. Wallace debated the function of zebra stripes, and in the 21st century new articles continue to appear in scientific journals offering fresh, unexpected perspectives. Recent decade studies include: 1) Does the flickering of stripes in a running zebra herd create optical illusions that confuse predators? (Answer – yes). How M.J., Zanker J.M. Motion camouflage induced by zebra stripes // Zoology (2013). 2) How do large predators (lions, hyenas, etc.) perceive zebra stripes under varying illumination and terrain? Do they see the stripes as we do? (Answer – no). Melin A.D., et al. Zebra stripes through the eyes of their predators, zebras and humans // PLOS ONE (2016). 3) Does striped coloration make a moving virtual object more or less detectable on a computer model? Is it easier or harder to miss? (Conflicting results – see the papers). Hughes A.E., et al. The role of stripe orientation in target capture success // Frontiers in Zoology (2015). 4) Are zebras preyed upon by lions more or less often than other herbivores? (More). Hayward M.W., Kerley G.I.H. Prey preferences of the lion (Panthera leo) // J. Zool. Lond. (2005). Hayward M.W., et al. Do lions (Panthera leo) actively select prey or do prey preferences simply reflect chance responses via evolutionary adaptations to optimal foraging? // PLOS ONE (2011). 5) Is it true that horseflies and other flies land less frequently on striped objects due to heat or polarized‑light perception? (True). Egri A., et al. Polarotactic tabanids find striped patterns with brightness and/or polarization modulation least attractive: an advantage of zebra stripes // J. Exp. Biol. (2012). Caro T., et al. The function of zebra stripes // Nature Communications (2014). 6) Is there a correlation between stripe intensity in a zebra population and the average temperature of its habitat? (Apparently yes). Notably, an active debate has unfolded in the literature: Larrison B., et al. How the zebra got its stripes: a problem with too many solutions // R. Soc. Open Sci. (2015). Caro T., Stankowich T. Concordance on zebra stripes: a comment on Larison et al. // R. Soc. Open Sci. (2015). Larrison B., et al. Concordance on zebra stripes is not black and white: response to comment by Caro & Stankowich // R. Soc. Open Sci. (2015). The overall verdict of most of these papers is roughly: “Much additional work is needed to elucidate the true functionality of striping in zebra”. Author’s scoring criteria for Task 4 The “raw” score was calculated out of 40 points: 10 points per animal.
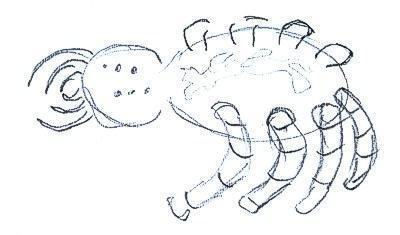
A score of 0 corresponded to the absence of a drawing, and a score of 10 to a 100 % representation of all details that, in my view, should be visible in the illustration. How the scores were assigned is easiest to explain with examples.
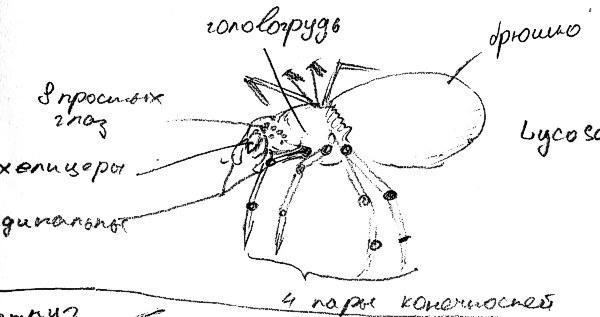
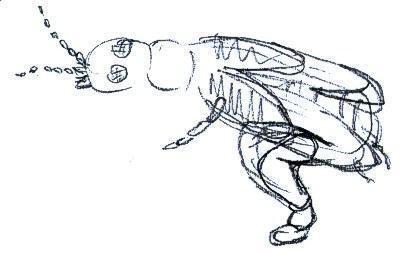
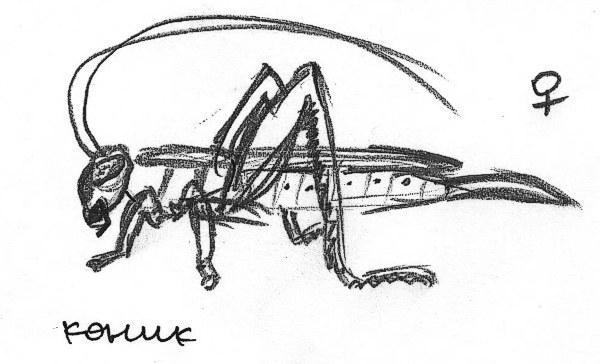
This tarantula received 3 points: And this one – 10 (it could have lost points for missing web‑spines and a vague head depiction, but I did not deduct them): This bush‑cricket received 2 points: And this one could not have received less than the maximum – 10: All participants performed well, and those who were afraid to come to the Olympiad are the ones who failed!" }