
Ecology: Biology of Interactions. VII-05. The Preconditions-and-Consequences Model: Simpson's Paradox and the Evolution of Altruism
The "Simpson's Paradox" model is an example of a "preconditions-and-consequences model" that tests the assumption of whether certain preconditions are sufficient for the emergence of a given property in the system under study. This model seeks an answer to the question: "Can group selection, in which groups with a higher proportion of altruists gain an advantage, truly overcome the action of individual selection, in which altruists lose to selfish individuals?"
Appendices: Curriculum. Questions. References. Persons. Glossary. R Commands.
VII-5. The Preconditions-and-Consequences Model: Simpson's Paradox and the Evolution of Altruism
VII-5.1. The "Simpson's Paradox" Model: Purpose and Working-Cycle Stages
For effective work on model development it is useful to examine a typical structure and characteristic working methods through a concrete example. As such an example we use the "Simpson's Paradox" model, which was created with the participation of the authors of this textbook (Shabanov D., Biriuk I., Bulba I., Kravchenko M., Nesterenko K., Vus N., Shabanov V. 2024. Typology of experimental simulation models in population ecology: Analyzing individual and group selection within the framework of Simpson's Paradox. Proceedings of ICTERI-2024: 19th International Conference on ICT in Education, Research and Industrial Applications; in press). This model builds on the ideas concerning levels of selection described in section I-18 and on the evolution of parochial altruism described in section IV-19.
The "Simpson's Paradox" model is an example of a "preconditions-and-consequences model" (see subsection VII-4.2). Models of this category test the assumption of whether certain preconditions are sufficient to account for a particular property of the system under study. The model under discussion was created to answer the following question: "Can group selection, in which groups with a higher proportion of altruists gain an advantage, truly overcome the action of individual selection, where altruists lose to selfish individuals? If this is possible, under what conditions will group selection spread altruistic behaviour?"
The "Simpson's Paradox" model describes the dynamics of a model population divided into G groups. Each group may include individuals belonging to the subgroups of selfish individuals or altruists. Intergroup competition takes place in the model population, and intraspecific competition takes place within each group.
Note the definitions used in this model and in the discussion of its results. Altruists are individuals who, to a greater extent than selfish individuals, increase the competitive ability of their groups, but have lower competitive ability than selfish individuals in intragroup competition. Beyond this, no additional meaning (including moral judgements) is attached to the concepts of "altruists" and "selfish individuals" in this context.
The size of the j-th group at the t-th working cycle of the model is denoted tNj; it consists of the sizes of two subgroups: altruists tnja and selfish individuals tnje. Clearly, tNj = tnja + tnje.
During the working cycle of the model the number of individuals in groups and subgroups is recalculated across six successive phases, denoted by Greek letters. Thus, within each cycle the following recalculations take place: αtNj → βtNj → γtNj → δtNj → εtNj → ωtNj, together with the corresponding recalculations of subgroup sizes. In the model script, Latin abbreviations are used instead of Greek letters: al_N, be_N, ga_N, de_N, ep_N, and om_N.
Thus, the model cyclically computes the following population sizes:
— α-size: initial; in the first cycle it is the result of group formation; in subsequent cycles it is determined by the ω-size;
— β-size: reduced groups; the size of groups after intergroup competitive reduction (subgroup sizes are not calculated at this phase);
— γ-size: reduced subgroups; recalculation of subgroup sizes in the course of intragroup reduction according to the β-sizes of subgroups;
— δ-size: result of reproduction;
— ε-size: consequence of dispersal; groups of individuals that, when vacancies arise (from extinct groups), relocate to those vacancies from the most competitive groups;
— ω-size: final population size after dispersal; end of the cycle and transition to the next cycle.
The working cycle of the model is shown schematically in Fig. VII-5.1.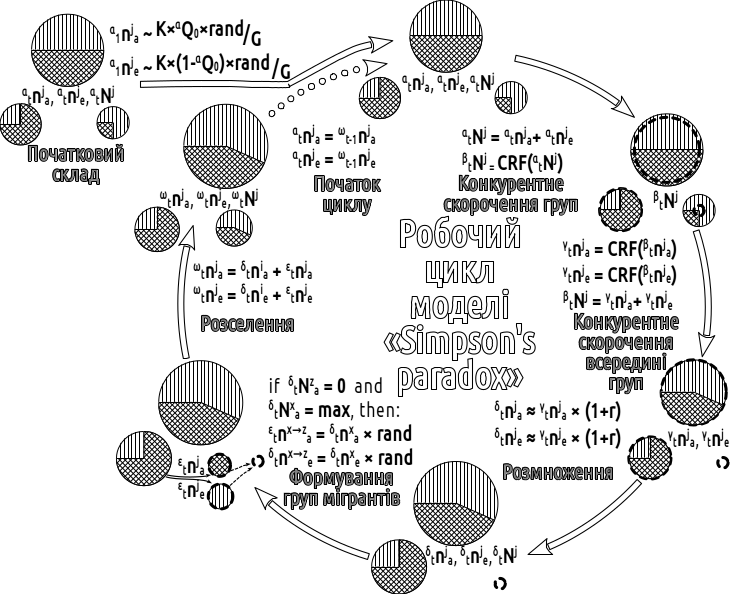
Fig. VII-5.1. Working cycle of the model
Fig. VII-5.1 uses symbolic representations of the processes occurring in the simulated groups. At the α-phase, three groups of different sizes are shown, differing in the proportion of altruists. The highest proportion of altruists (shown in red) belongs to the second-largest group. At the β-phase, competitive size reductions of the shown groups are calculated. The largest group undergoes a minor reduction; the smallest group undergoes a very substantial one. The group with the highest proportion of altruists, by contrast, retains its size; this occurs for groups with the highest competitive ability. At the γ-phase, intragroup reduction takes place: in the largest group this leads to a decrease in the proportion of altruists; the smallest group simply goes extinct; and the most competitive group is preserved unchanged. At the δ-phase, proportional growth of the two remaining groups occurs. The ω-phase involves dispersal of the most competitive groups into vacancies (extinct groups). The dispersing group is randomly split into two parts. The described events then repeat in the subsequent working cycles of the model.
VII-5.2. "Simpson's Paradox": General Algorithms
Let us enumerate the input parameters of the model. As already stated, one of the input parameters is G — the number of groups.
The measure of the intensity of intragroup competition is ac — the internal competitive ability of altruists; the ratio of the intragroup competitive ability of an altruist individual to that of a selfish individual. The value of ac ranges from 0 to 1. The measure of the intensity of intergroup competition is EC — the external competitive ability of selfish individuals; the ratio of the contribution of a selfish individual to that of an altruist to the competitive ability of a group. The value of EC also ranges from 0 to 1.
The intensity of reproduction (identical for both altruists and selfish individuals) is determined by the parameter r (Malthusian parameter, the growth rate). Competitive intergroup reduction of population size occurs when the total population size across groups exceeds K, the carrying capacity. The lower the competitive ability of a group, the more strongly its size is reduced. The calculation of group competitive ability also uses the value OptN — the optimal group size, i.e. the size of a group consisting exclusively of altruists and possessing the highest possible competitive ability — and AQ0 (the expected value of the initial proportion of altruists in the groups).
Thus, the set of initial parameters for running the model consists of G, ac, EC, r, K, OptN, and AQ0. In addition, the model run is governed by the following experimental conditions: the number of cycles in each simulation (cycles) and the number of iterations in Type II, III, and IV models: simulations executed with identical initial parameters (iterat). When the model is run in parameter-sweep mode, the initial and final values of the parameters being varied are specified, along with their step sizes.
VII-5.3. The User-Defined Function CompetitiveReduction — Competitive Population Reduction
To simulate intergroup and intragroup competition the algorithm described previously is used. This algorithm implements the reduction of group sizes in the model population to a specified limit (Capacity). This reduction must satisfy an important condition: the initial size of each group, αNj, is reduced to a size βNj such that, in each group, the proportion of individuals surviving the competitive reduction is proportional to the competitive ability of the members of that group, αCj.
To implement this, a user-defined function CompetitiveReduction is created in R. The input arguments of this function are: the value Capacity (the limit on total population size) and two vectors — Amounts (containing the number of individuals in each group) and Competitiveness (specifying the competitive ability of each group). Competitiveness must be specified as a value from 0 to 1. At the "input" to the function this indicator may be specified differently, but it will be rescaled so that the maximum competitive ability value corresponds to 1 (this rescaling is not shown in Fig. VII-5.1).
Fig. VII-5.2 shows what constitutes the input to the function under discussion: the total population limit Σ(βN) and two vectors — group sizes and their competitive abilities. On the basis of these data, the total current population size Σ(αN) is calculated, along with the competitiveness-weighted sizes and the total weighted size Σ(qN). Then, based on the relationship between Σ(αN), Σ(qN), and Σ(βN), it is determined which scenario will be used for the reduction: W1, W2, or W3. The conditions governing this choice are shown in Fig. 3 both symbolically (a schematic "balance" indicates which of these quantities are larger and which are smaller) and using mathematical inequalities. Depending on the chosen scenario, the formula used to compute βNj is determined.