Biology. Introduction to the specialty. Task III: Creating a table for collecting primary data
Canon of constructing a table for primary data collection: 1. Collection of primary data («answers of nature» to the researcher) — is a consequence of the necessity to obtain an answer to a certain question! 2. When constructing a table for data, one should foresee, in case of success...
TASK III: Creating a Data Collection Table
A number makes sense when it takes its place.
Students must plan a table for collecting primary data of a biological (or biology teaching-related) study, which will meet the requirements of the Canon for Constructing a Data Collection Table presented below. This table should be created either in spreadsheet programs (Excel, Calc, Google Sheets, etc.) or in a word processor that allows working with tables (Word, Writer, Google Documents, etc.). The result of this work should be uploaded to the Telegram feed in a format that can be read without distortion on any platform, preferably in *.pdf format (note: tables in *.docx format may open distorted, for example, using Linux tools). The file name should be Surname_Task III.
|
№ |
Distance from the stream |
Benthos or Periphyton |
SW |
SH |
Description of the place |
Comments |
The result should not be a data-filled table, as these data should be obtained directly during the study. Of course, a simply ruled sheet with empty column and row headings is also insufficient. This should be a table where column names are defined and specified, and it is clear what should be in the rows.
To create such a table, read and understand the fragment of the online textbook on using statistics in biology (copied below, "How Should a Table with Primary Research Data Be Organized?"). Below is an example of constructing a data collection table ("Simple Example: Viviparous Shell") and several ideas for developing such tables are proposed ("Research Ideas for Which a Data Collection Table Can Be Developed").
As explained further, there are three options for choosing questions to which primary data should be collected:
— choose one of the proposed examples (and specify which example the table was constructed for);
— choose any scientific biological article that includes statistical data analysis (and provide a link to the article or add its copy);
— independently formulate a question to which primary data should be collected (and present this question).
Primary data are the direct results of individual observations or experiments: an individual measurement, an individual value. Biology is an empirical science based on the results of observations and experiments. Before starting them, one must determine what data, specifically, will be collected. To collect and store these data, tools (most often—tables) are needed for collecting such data. The generalizations that will be built over time based on primary data will be the next step of the research. Does, for instance, the height of the tallest student in the class belong to primary data (or the average ear length)? No. Primary data are specific data about the height of each individual student, about the length of each ear; once they are collected, they can be analyzed and the maximum or average value can be determined. The average, maximum value, etc. are calculated values.
Note: the task requires creating exactly a table for primary data. The logic of constructing such a table begins with defining the problem, the question to which answers should be found in the observation results. The problem determines the observations (or experiments) that must be conducted to obtain the necessary answer. What objects should be studied? What traits of objects are important for answering the posed question? How to determine them, in what order, how to record them? The "healthy" approach to planning a primary data table is exactly this: "Problem ⟶ Required Observations ⟶ Set of Traits to Determine in the Study Objects."
Let us compare examples of a primary data table and a summary table for analysis results. Suppose we analyze an article stating that at a certain age girls grow faster than boys (although earlier and later, on average, boys are taller). The article presents a table with calculation results of average height of boys and girls of different age. How did such data appear? Can one simply measure the average height of some group of people? This is impossible. Calculations in the summary table must be based on certain primary data—results of measurements of individual individuals. While performing this task, students must understand what primary data tables stood behind the results they see in this or that work. It is not necessary to fill all cells of the primary data table (neither with invented nor real data!); these tables should be planned, with column headings placed that will determine the sequence of observations in a similar study. You look at work completed by someone else and understand exactly how you would have to do it if you decided to repeat it!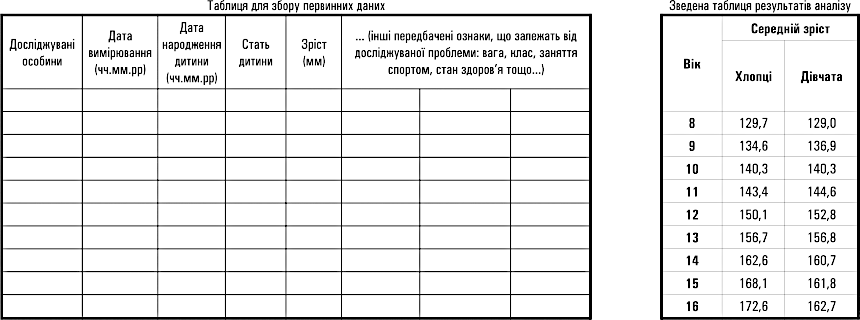
How should study individuals be characterized in the table provided? Perhaps by name. Perhaps by sequential number in the study. Perhaps by medical record number. The answer to this question depends on the study organization and bioethical requirements that should be followed in it.
What other traits should be indicated in the primary data table? It depends on the questions the researcher is seeking answers to. Most likely, this is the characteristic of the group to which the individual belongs (city, school number, or something else). Perhaps these are measured hormone levels, perhaps—sports, perhaps—nothing more is needed.
Should columns for calculating certain values be included in the primary data table? It is better not to do this. As stated further (requirement No. 7 of the canon in the next section), data analysis is best conducted in specialized programs. Let the primary data table contain what is collected during observations and experiments, and analysis will be somewhere else.
Should several columns be included in the table among which one should be chosen (for example, two columns: "Boys" and "Girls" or "Males" and "Females," if the study concerns animals other than humans)? According to requirement No. 13 of the canon, there should be one column in which the state of the trait can be indicated: "female" or "male" (or leave the field empty or indicate "NA" if sex cannot be determined). Should "female" or "male" be specified in advance in a certain number of rows? Categorically, no! The order of rows in the table should determine the order in which objects come into the researcher's hands, and this order is influenced by random factors.
Experience in analyzing tables created by students shows that these tables contain a lot of unfounded fantasies. Probably, it would be useful to simply imagine how the filling of such a table would occur. Here, you are collecting primary data... In your hands is the first, then the second, third objects. What traits do you take from them, read off? How is the state of traits that will be entered into the table determined? In what order is it best to establish these traits? Will performing such actions make it possible to establish the answer to this question that is the reason for conducting the research?
How Should a Table with Primary Research Data Be Organized?
Natural sciences are based on empirical (from Greek ἐμπειρία—experience) research of nature, that is, research based on observation and experiment. There are also purely theoretical (from Greek θεωρία—consideration, research) works in natural sciences, related to the internal development of a certain model, but such works are secondary—they are the result of analysis of empirical, primary data. Where do these data come from? They are collected during research. Thus, the collection of empirical, primary data is the foundation of all natural sciences, including—biology. It is very important to learn to collect these data in such a way as not to limit the possibilities of working with them further.
Most often, empirical data are collected either in numerical form or in a form that can eventually be converted to numerical form. There is a point of view that where there is no mathematics, there is no natural science. Most likely, one can imagine work whose foundation does not include mathematics, but of course this should be a rare case. The main problem is that the researcher must ensure that their experience reflects general patterns. You turned over a leaf and saw a caterpillar on its underside. Is this a universal experience or not? We are sure that under the turned leaf there was a caterpillar. But can we, based on this experience, draw conclusions about other leaves? You turned over the next leaf, and under it—there is a frog. Most likely, to establish what hides under such leaves, one should turn over a certain number of them and register whether there was something under them, and if there was—what exactly. Quantitative assessment will be needed here... We moved from object (leaf) to object (next leaf) and registered their traits that are important for us (is there someone under it or not; what kind of leaf it is, how it is located, etc.).
You have obtained certain empirical data. What to do with them? Remember? This solution is not reliable. Our memory is selective, our recollections are influenced by our attitude toward what we tried to remember. Memory loses one thing and substitutes another... Write on paper? This is already a good solution. But it must meet certain requirements. Each subsequent result should be recorded immediately as soon as it is obtained. Records should be made identically, regardless of what they are (for example, whether the result pleases the researcher or not). Paper (or other medium) on which the results of empirical research are saved becomes an important document. It must be preserved, and it must not be edited over time! Therefore, primary records are usually made in a laboratory journal where a certain table is constructed for data storage.
It is very useful to preserve primary data in other forms as well. These can be photographs, audio recordings, printouts of device readings, etc. This should become not a replacement for records in the laboratory journal, but their addition! By the way, it is often very useful after filling a page of the laboratory journal to photograph it and place such a digital photograph, for example, somewhere in a cloud environment...
In the modern world, primary records are quite often made not in a paper journal, but immediately in digital form—in a file (most often—electronic spreadsheets, such as Excel, Calc, Google Sheets). In this case, such a file should be treated as a paper laboratory journal—preserved indefinitely, existing records should not be edited. This is a carrier of primary data that preserves the trace of the most important stage of the research: the researcher posed a certain question to nature, received an answer, and preserved it! This file is the table for collecting empirical data, the database created during the research.
Another option for work organization is when primary data are collected in a laboratory journal (or on paper forms with which the researcher works in field conditions), and then transferred to a file-table. In this case, both paper primary documents and the primary file should be preserved. They should be organized in the same way to reduce the probability of errors during transfer (and they should be preserved so that such errors can be found).
Work experience with students and researchers shows that very often major problems in work are related to the fact that the table for collecting primary data of empirical research is constructed incorrectly. Many considerations have influenced how to properly organize the collection and preservation of primary data. Some of them have historical explanations, some are related to peculiarities of the statistical analysis itself. At the beginning of the course, there is no sense in analyzing all these considerations in detail; it is much better to present them in the form of a certain canon. In this case, we understand the word "canon" as a clear set of rules. Of course, if necessary, one can deviate from the canonical organization of data, but this innovation has the right to exist only in the case when there are sufficient grounds for it. Previously, the canonical requirements presented below we called "commandments," but over time we abandoned this metaphor. Violation of commandments can be considered a sin; unlike the requirements of commandments, when it is needed due to significant reasons, one can deviate from the canon. However, in most cases, one should simply follow the canon.
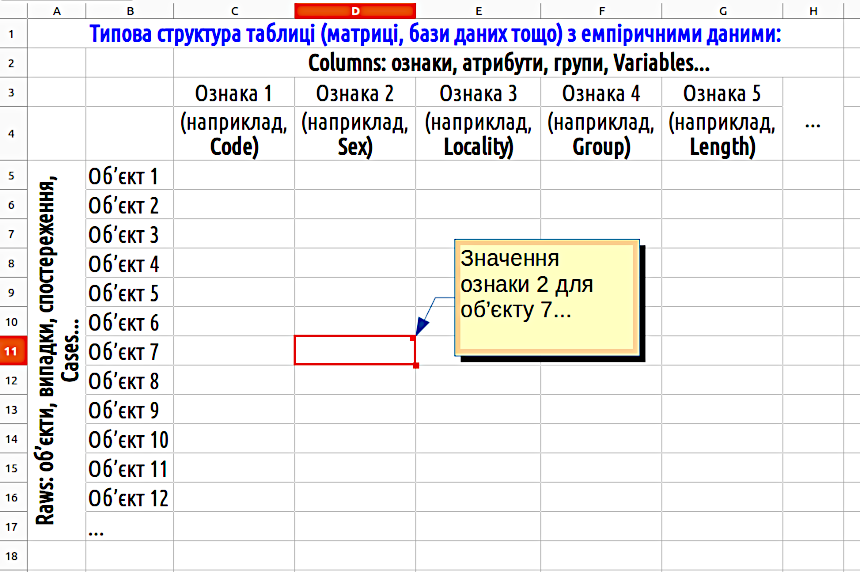
Let us give one example. The canon requires that in the table with primary data, rows correspond to individual objects, observations, measurements, etc., and columns—to traits. Could one do it the other way around? One could! In some types of analysis, one even has to transpose (swap rows and columns) such a table. But data are collected exactly this way. Among other things—because everyone (who understands) does it this way. And they do it this way because it corresponds to the logic of working with a laboratory journal. In European culture, records are made in rows, not in columns. A separate observation—a separate row, and columns reflect what should be taken into account to further work with this observation. The data file should be organized the same way as a page of the laboratory journal to reduce the probability of errors during data transfer.
Please, make your understanding of primary data organization (and files for analysis) correspond to this canon by default!
Canon for Constructing a Data Collection Table:
1. Collection of primary data ("answers of nature" to the researcher) — is the consequence of the need to obtain an answer to a certain question!
2. When constructing a table for data, one should foresee how, in case of success of the research, the answer to the initial question will be obtained!
3. The answer to the initial question is not only a description of the result ("what came out"), but also a determination of its statistical significance!
4. Statistical significance of the result is the probability that it occurred due to chance during the formation of the studied sample!
5. In empirical data, there are answers to questions not yet posed and even not yet realized yet; they should be preserved without time limit!
6. Primary data should be duplicated in different forms (paper laboratory journal, forms, files, photo records...)!
7. Typically: on paper and in electronic tables—data collection, table creation; analysis—in specialized programs!
8. Transfer, recoding, reorganization of data is a source of new errors; the initial version should be preserved!
9. Not all possible objects are described? Think through, select, describe, and implement randomization (random selection)!
10. Table rows are individual objects or independent observations, columns are traits; in a cell—the state of the trait for this object!
11. The entire data array of the research—in one table! Rows not used in analysis can be marked in a certain column!
12. In each column—uniform data, in the same units, of the same format, measured identically!
13. All uniform data, in the same units, of the same format, measured identically—in one column!
14. The group to which the object or observation belongs is given as a separate trait (not by the position of the record on the sheet or in the table)!
15. In each row—all traits (in certain columns) that determine the uniqueness of the observation (so that it can be sorted)!
16. For each trait, select its type, method of determination or measurement, coding, format, recording precision, etc.!
17. Quantitative traits: either measured (=continuous, metric), or counted (=discrete), or ordinal (=ranks)!
18. Qualitative traits: either alternative ("present—absent"), or multiple ("yes, so, or otherwise")!
19. If primary data are not symbolic (photographs, etc.), a separate column—reference to them in "cloud" storage!
20. In each cell—one certain trait (not, for example, two different ones, like month and year for natural observations)!
21. "0" is a certain number; absence of data is an empty cell (in programs it can be denoted as NA, "not applicable")!
22. The order of columns should reflect the order of their determination; calculated values can be placed after empirical data!
23. In electronic tables and statistical programs, calculations—by formulas (can be repeated or corrected)!
24. Trait names and their states—preferably in Latin script (fewer problems) + as detailed explanations as possible for yourself and others!
25. File names with primary data—informative, immediately understandable; their storage locations—predictable, clearly labeled!
26. The researcher's life will be simplified by a journal or file where the methodology, all work stages, and everything unusual in its course are described!
27. Data quality verification—visualization of their distribution; a scatter plot will show outliers and entry errors!
28. After obtaining the first fragment of the database—conduct a pilot analysis and correct deficiencies in research organization!
After the initial formulation of this canon, its author requested help from collective wisdom. Thanks to advice from qualified Facebook friends, the requirements of this canon were significantly improved. The authors express special gratitude to Professor Oleksandr Zhukov for important assistance.
A table that meets the requirements of the canon provided can look, for example, as shown below. Rows are individual observations, columns are traits. In each cell—the state of the trait corresponding to the column for a certain observation (row).