

I. Vertebrates Zoology-05. Requirements for Student Research Projects in Field Practice
An important component of the vertebrate zoology field practice conducted after the completion of Year II is the so-called SRSP (Student Research and Study Projects). This page describes how they are carried out and what requirements they must meet.
Objectives and Structure of the SRSP
An important component of the vertebrate zoology field practice conducted after the completion of Year II is the so-called SRSP (Student Research and Study Projects). In the view of the author of this page, these projects are the most important part of the practice. Students completing the practice on an individual schedule are expected to prepare such projects largely independently. The primary objective of the SRSP is to demonstrate that the authors understand the scientific method and the typical structure of a scientific investigation, and are capable of applying them in practice.
During the practice, the SRSP is carried out during time allocated for this purpose in classes and during independent study time. The outcome of the SRSP is a presentation and a report delivered at the final conference. The report should last 5–7 minutes, after which the presenters answer questions from instructors and the audience. A written paper is not required during the practice. Based on the results of successfully completed SRSPs, students prepare abstracts for a youth scientific conference and/or other publications.
How is the SRSP carried out? Its main stages are as follows:
— together with the instructor, select a relevant and feasible topic and plan the work;
— collect a dataset of reliable observations that allows comparison of its parts with one another and statistical analysis;
— analyze the data using appropriate methods and draw well-founded conclusions;
— present the work as a presentation at the final conference;
— present the work as an abstract for a youth scientific conference or as an article for a journal.
What data may be collected during the SRSP? There is no single answer. Some examples are provided below (this list is by no means exhaustive):
— morphometrics (comparison of representatives of different species, sexes, and local populations; study of proportional changes in individuals of different ages; measurements of nests, burrows, etc.);
— population censuses (transect surveys, mark-recapture methods, etc.);
— spatial distribution of individuals;
— probability of different responses to a given stimulus (movement, etc.) under varying conditions;
— co-occurrence or avoidance;
— fluctuating asymmetry;
— variation in coloration patterns, pholidosis (scalation), etc.;
— analysis of vocalizations and movement trajectories;
— relationships among growth, weight, age, and other measurable parameters;
— changes in the intensity of a given process (respiration, locomotion, color change during background adaptation, etc.) as a function of time of day, temperature, and so on.
Since the SRSP requires the collection of a dataset, the work must be conducted on abundant (common) species inhabiting the area around the biological station. These include:
— common fish species;
— green frogs and their tadpoles;
— common bird species;
— murine rodents;
— humans (when studied as zoological rather than social objects), etc.
In the most general terms, the objective of the SRSP (as with any other research project) is to establish a relationship:
— a relationship between membership in a given group and certain characteristics;
— a relationship between a treatment and its response;
— a causal relationship;
— a relationship between an organism and its preferences in food or habitat selection, etc.;
— a relationship between successive actions or behavioral patterns of a given subject;
— a relationship between the co-occurrence of different traits, etc.
The SRSP must seek an answer to a specific question (indicated by the research objective). An important requirement is that this must be a question for which no specific answer yet exists, as this is a defining characteristic of scientific inquiry.
Suppose the subject of the study has been selected and the dataset collected. Comparing parts of the dataset, we observe that they differ with respect to certain characteristics. Can we conclude that the study has identified a relationship between certain traits or phenomena? Before drawing such a conclusion, one must bear in mind that the study examined not the entire reality, but only a portion of it—a sample. Could the observed difference between the compared groups be the result of chance?
The key question that must be answered in the course of preparing the SRSP is: Does the observed difference between the compared groups reflect causal relationships in reality, or is it the result of random variation in sample formation?
To answer this question, it is necessary to determine the statistical significance of the obtained result. Statistical significance is the probability that the result obtained during the study can be explained by chance variation in sample formation—in other words, it is the probability of the null hypothesis.
If this probability is low (0.05 for exploratory studies; 0.01 for confirming contested questions; 0.001 for justifying actions that affect human life and health), the null hypothesis is rejected and the alternative hypothesis is accepted (which accepts the existence of the observed relationship between the traits and phenomena under investigation in reality). The problem of statistical significance is discussed in greater detail in this online guide.
It is advisable not to confuse the concepts of significance and reliability. The statistical significance of a result is the low probability of its occurring by chance. The statement “two samples differ significantly” means that the probability of obtaining them from the same population is so low that it can be considered proven that they were obtained from different populations.
| Requirements for scientific research. The “cherry on top” of this pyramid should be not merely a well-deserved high mark for the SRSP, but a quality publication of its results. | 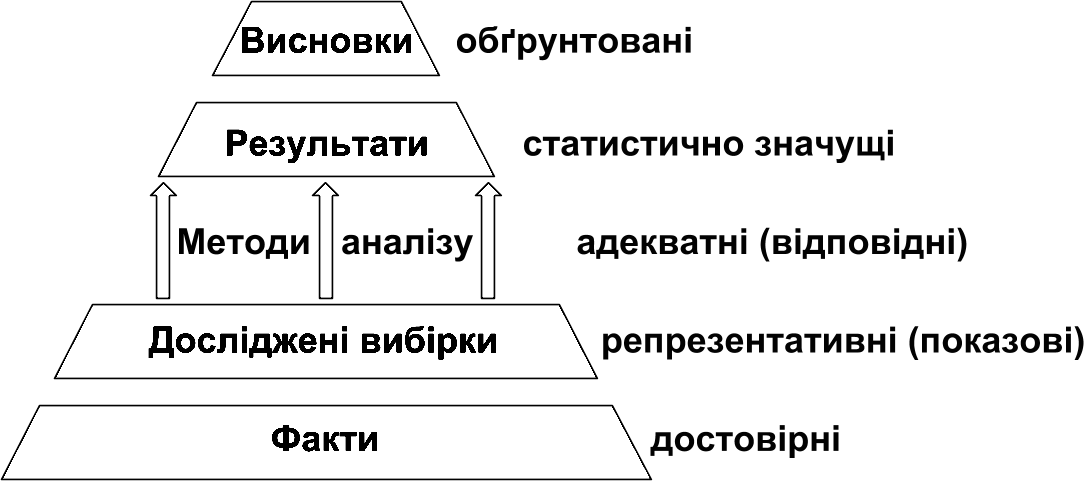 |
“Reliability” is a much broader concept that can be used in various senses and has no mathematical definition. It is used to denote securely established knowledge. Science aims to obtain reliable knowledge. The facts collected in the course of a study must be reliable. In any study, not all possible facts are examined, but rather certain samples. These samples must be such that their investigation allows the research objective to be achieved—that is, they must be representative. Reliable facts must be analyzed using appropriate (adequate) methods. If statistically significant results are obtained from such analysis, well-founded conclusions may be drawn on their basis.
Presentation of the SRSP
The typical structure of a presentation based on the results of the SRSP is as follows.
Title slide. The topic of the work and the names of the students who carried it out must be indicated. If the work was conducted in collaboration with a supervisor, the academic supervisor should be listed. One should not list as the academic supervisor someone who is seeing the work for the first time during the presentation. Naturally, the label “title slide” is superfluous. Quite often, this slide (or other slides) includes photographs (of the study subject, the research process, etc.). It is preferable if the photograph belongs to the authors. Otherwise, it is mandatory to indicate this in the presentation. This can be done with a small-font caption on the title slide itself (e.g., “photo from uk.wikipedia.org”), or, for example, on a separate slide at the end of the presentation (photo sources: ...). The latter option is preferable as it allows a full URL to be provided.
Background / Rationale (if necessary; may be presented on a single slide, or, if needed—as when describing a long history of previous research—on several slides). The rationale for conducting the study lies in its potential to provide an answer to a specific question. Why is seeking an answer to this question useful or interesting? What other questions is it related to? Of what broader problem is the question under study a part? If the study continues a series of prior investigations, their results should be briefly described. What has been established? What remains unknown?
On this or other slides, it will likely be necessary to cite other works, bibliographic sources, or other sources of information (e.g., websites). On a slide, a citation may take the form (Surname Year); (Name et al. Year). In presentations other than those prepared based on SRSP results, such a citation may be sufficient, since more detailed references can usually be found in the written work itself. Since the outcome of the SRSP is only a presentation, the full reference must be contained within it. Therefore, in the case of the SRSP, either on the same slide where the citation appears, or on a dedicated slide at the end of the presentation, full references to all sources used must be provided.
If a quotation from a source is used in the presentation, it must be enclosed in quotation marks, and the reference should, in most cases, indicate the specific page of the document from which the quotation was taken. If an idea is paraphrased or a specific fact is discussed, a reference to a particular page of the source may also be provided.
Research objective. When formulating the research objective, the presenter sets the framework within which their investigation will be evaluated. In order for the subsequent elements of the work to be assessable, it is necessary to state what the authors intended to establish. If necessary, the research objective can be “unpacked” into several tasks corresponding to distinct stages of the investigation. In a relatively small study such as the SRSP, a list of tasks is not mandatory (but is entirely permissible).
Data collection method(s). It is important that the text of the presentation makes clear where the authors obtained the data with which they worked. How did they collect the sample under study? What did they do to ensure that the sample was representative (i.e., that its characteristics corresponded to the population from which it was drawn)? The slides describing the research methodology should not be abbreviated. From them, a listener or reader should receive sufficient information to reproduce the work independently.
Material: the data that the authors collected and analyzed. How many observations were processed? How many individuals were studied? If, for example, blood cell sizes were studied across different individuals, the number of cells examined, the number of preparations, and the number of individuals they represented should be stated. What was the composition of the sample?
A non-mandatory but desirable requirement for the work is that, when describing what the authors did, one should state it directly. “Data that were analyzed” is better than “data that was analyzed” [in the passive impersonal sense]; “individuals were photographed” — better to say “we photographed individuals”; “data were entered” — better as “we entered the data,” etc.
Data analysis method(s). The most important thing this slide (and section of the work) should convey is how the authors organized the data analysis, not which software they used. “Data were analyzed statistically” is an empty formulation, unlike “The effect of... on... was analyzed using analysis of variance, in which... was treated as the independent factor and... as the dependent variable; the analysis was performed in...”. An important question that must be addressed is whether parametric or non-parametric methods were used. If samples are compared across many traits, or if many samples are compared with one another, a correction for multiple comparisons should be applied.
Results. Discussion. The structure of this section of the report depends on the nature of the work. If the results can be divided into several steps, it becomes possible to follow each specific result immediately with the conclusions that can be drawn from it, and then move on to the next step—or alternatively, to enumerate all results first and then discuss what conclusions may be drawn from them.
When presenting the results of statistical analysis, it is advisable to use visualization methods (value distributions, proportion comparisons, histograms, etc.) and to indicate statistical significance, specifying the test that was used. A conclusion based on statistical analysis should explain what was specifically found, for example, “the proportion of... in the case of... is higher than in the case of... (p = 0.02).”
Conclusions. The conclusions are the primary and concise outcome of the work. They should be formulated as concisely as possible. “Based on the research conducted, the following conclusions can be drawn...” and all similar padding phrases are impermissible; all such turns of phrase should simply be discarded. If several objectives were set for the work, each objective must correspond to at least one conclusion.
Conclusions should contain statements whose establishment is the result of carrying out the work (and, in the typical case, corresponding specifically to statistically significant results). Sometimes the outcomes of the work may also be indicated. For example, if the study was devoted to estimating population size by the mark-recapture method, the conclusion of the work is a specific population size estimate, while the result is the existence in the population of a certain number of marked individuals that may be used in further studies.
Sometimes, after the conclusions, a slide may be devoted to the prospects for further research clarified through the completed work.
Sources. If the sources of borrowed photographs, data, methods, etc. were not specified in detail on the corresponding slides, this may be done on a separate slide.
Acknowledgements. Quite often, presenters express thanks to the audience. Good form is to accompany this acknowledgement with a witty photograph (taken by oneself or obtained from a cited source). Before this, one may express gratitude to those who assisted in carrying out the work. One should not be afraid to express thanks: remembering who helped you does not diminish your merits, but demonstrates that you are a responsible and grateful person.
Attention! The presentation must be structured so that it can be delivered within 5–7 minutes. For example, if your presentation has 15 slides, each may be allocated, on average, no more than half a minute. During that time, listeners must understand everything you are communicating to them through the slide. A consequence of this requirement is minimalism in the construction of the presentation and, above all, in the design of individual slides.
The size of text in the presentation must be such that it is easily readable from the most distant seat in the venue where the report will take place.
An important problem the presenter must resolve is how the text on the presentation slides should relate to the spoken report. There is probably no universal solution, and in seeking an optimum for each specific work, the following should be taken into account:
— the text of the presentation must be comprehensible in its essentials without the spoken report;
— the spoken report must be comprehensible in its essentials without the presentation;
— the presentation and the spoken report must be consistent with each other and facilitate each other's comprehension;
— the spoken report and the presentation must not coincide verbatim (listeners find it difficult to follow a presenter who reads aloud the captions on the slides);
— individual important words and phrases may be read from the slide, but in general the spoken report can exploit the advantages of oral speech, drawing attention to the most important points;
— the language of both the presentation and the report must be clear and lively; a common mistake is to attempt to use complex “pseudo-scientific” language constructions, which only hinder comprehension.
Fulfilling all of these requirements, keeping within the allotted time, and clearly conveying everything necessary to the audience is a challenging task. Nevertheless, it is possible to accomplish, and it is precisely in order to learn how to do so that you conducted the SRSP.
Primary Requirements for the SRSP
It should be understood that the primary criterion in evaluating the SRSP is not the scale of the results, but the clarity and transparency of the process by which they were obtained, and the authors' understanding of the principles of the scientific method and the structure of scientific inquiry. Improperly attributed borrowings of others' results, undefined research methodology, errors in data analysis, or conclusions not grounded in the authors' own research can nullify the results of a major undertaking. During the defense of the SRSP, great importance is attached to how confidently the authors command the material and whether they are capable of providing competent answers to the questions posed to them. The report should be delivered in simple and comprehensible language, without artificial complication. It is better not to read the report but to tell it—as a person who has carried out the work would describe it.
Key requirements for the SRSP:
— it is mandatory that the presentation itself makes clear what work the authors performed, which results, texts, and statements are their own, and which were taken from other sources;
— the authors must use data obtained by the described methodology; these data are analyzed statistically, and the conclusions are based on that analysis;
— the authors have honestly described what they did and stand behind every word;
— all borrowings (photographs, data, information) must be described transparently and accurately;
— the authors must fulfill the research objective they themselves set; fulfilling the objective means obtaining conclusions based on data that the authors collected and analyzed according to a defined methodology.
Examples of Ideas for SRSP Projects
The author of this page studies primarily hemiclonal population systems (HPS) of the hybridogenetic complex of green frogs. The ideas listed on this page pertain specifically to this topic and in no way limit the possibilities for studying other animal groups. Examples of publications at the student scientific conference based on the results of such projects can be found here:
Student projects after Year II practice - 2017
Student projects after Year II practice - 2016
Student projects after Year II practice - 2015
Student projects after Year II practice - 2014
Student projects after Year II practice - 2013
Student projects after Year II practice - 2012 (Part I)
Student projects after Year II practice - 2012 (Part II)
Student projects after Year II practice - 2011
Student projects after Year II practice - 2010
Student projects after Year II practice - 2009
Student projects after Year II practice - 2008
In the vicinity of the university's biological station, several HPSs are located that serve as monitoring objects (Iskiv Pond, Koryakov Ravine, Nizhniy Dobritsky Pond). When studying these HPSs, frog samples should be collected and their composition determined. Toe-clipping for blood smear preparation constitutes marking. Based on the number of individuals marked during previous surveys, population size can be estimated. Blood smears allow determination of individual ploidy, and external morphological features allow taxonomic identification.
Studies in recent years have demonstrated that the generational composition (cohorts of same-age individuals) of green frogs changes with age. This process is important for maintaining the stability of HPSs. Thus, studies examining differences between samples of different age classes may have considerable potential.
In the author's view, studies of developmental stability in individuals from different populations or of different forms are of interest. An example of such work conducted on frogs can be found in this article. Students during practice have repeatedly conducted studies on fluctuating asymmetry (FA). FA studies on fish have proven successful, while results obtained from frogs have been more contradictory. The field remains open for investigation.
Studies related to the assessment of phenetic distances (measures of external morphological differences) between individual frogs may also prove promising. This is because hybrid individuals in HPSs may belong to specific semi-clonal lineages (sharing one identical genome in their genotype) or even to the same clone (sharing identical genotypes). One would expect that in a sample containing clones, a significantly elevated number of morphologically similar individuals could be detected.
For the study of tadpoles, it would be interesting to develop methods for sex determination. The sex of metamorphs at dissection can be determined quite reliably. A project in which, during morphological examination of tadpoles at earlier developmental stages, methods for determining sex by dissection under a binocular microscope could be established would be of interest.
Behavioral studies of green frogs are also possible. For example, it would be interesting to condition frogs to respond to the movement of a light spot from a laser pointer as a potential prey stimulus. Does such a reflex develop equally in diploid and triploid individuals, in hybrids and in representatives of the parental species? Is it possible, using a tablet screen or a portable projector, to condition frogs to feed on stationary food?
It is known that chemical communication among tadpoles affects their development. But which groups would a tadpole preferentially join: groups of older or younger individuals?
How does the skin color of a frog (measured using a calibrated photograph taken under fixed conditions) change depending on illumination and temperature? If frogs respond to light, does red, green, or blue light exert the same effect?
You approach the bank of a water body. Are the frogs distributed along the bank randomly or according to a specific pattern? What pattern? If you have photographs of individual positions from which taxonomic identity and sex can be determined with sufficient probability, you could establish whether Pelophylax esculentus and Pelophylax ridibundus, and males and females, are distributed randomly relative to one another. How reproducible is the distribution of individuals in photographs taken after a certain interval? A drone could be used to conduct such work.
How does the intensity of frog vocalization at a given water body change over time? What is the interval between intense chorus calling and scattered individual calls? How does this interval depend on time of day and on the phase of the breeding period? An audio recorder could be used for this project.
What should be the optimal acoustic stimulus (a playback of frog calls reproduced in a particular manner) to elicit a response from the greatest number of frogs?
Is it possible to develop a program that, based on a simple description of a given individual, would generate an approximate composite image (a photofit for frogs)? What traits should be used in such a program, and what states of those traits?
Projects that study the research process itself may also prove interesting. Different students measure the same quantity. How much do their results differ? How are the differences related to the measurement approach? How does a detailed definition of the methodology affect this? How does the reliability of measurement by the same person change over time?
The list of ideas for SRSP projects remains open. Dear readers! If you have interesting ideas for implementation—please share them, at least in the comments to this page...