
Ecology: biology of interactions. VI-07. Demographic transition
{"translated_text":" "}
VI-7. Demographic Transition
What accounts for the population growth discussed in the previous section? It might seem to some that it is due to higher birth rates: if there are more people, then more are being born. Surprisingly, the situation is the opposite: the population growth is associated with a change in the nature of mortality. Of course, everyone born into the world will eventually die, but for population dynamics, it matters greatly when this occurs. The "surge" in human numbers at the end of the 20th century is related to the shift from pre-reproductive (before reproductive age) mortality to post-reproductive (after leaving descendants). In other words, if a century ago most newborns died in the first days and months of life, in recent decades most of them have survived to reproductive age and left some offspring. The change in the ratio of births to deaths, accompanied by rapid population growth and then its stabilization, is called the demographic transition. The author of this concept is American demographer Frank Notestein, who in 1945 summarized both his own results and the achievements of his predecessors.
To understand why the population grows, one must determine under what conditions it remains constant. The population does not change if each subsequent generation is the same size as the previous one. This is possible if, on average, each mature woman has one daughter who survives to maturity (or, given equal sex ratios, each pair of parents has two children who survive to maturity). If all newborns survived to adulthood and then had children, two children per couple would be sufficient. Since at least a small portion of people will never reach reproductive age, and some definite portion will not have children, even in a society with very low pre-reproductive mortality, slightly more than two children per couple are needed to maintain a constant population. In a society with inadequate medical development and high infant mortality, even to maintain a constant population, each couple must have many children. Under conditions where only one in five newborns survives to reproductive age, a constant population corresponds to more than 10 births per couple (and per woman). However strange such a number of children may seem to modern humans, it is normal for our species! Just a century ago, it was entirely typical.
Medical advances led to a sharp decrease in infant mortality—first in developed countries and then in developing ones. Fortunately, infant mortality is declining sharply, but this has almost no effect on birth rates. People born into large families themselves have many children. Birth rates significantly exceed death rates, and the population is growing rapidly. Technological progress allows feeding a much larger population.
In the pre-industrial era, the majority of the population lived in villages. With population growth, there was not enough land for everyone, many peasant children left for cities and began living new lives. The break with traditional values and peasant culture leads people to have relatively few children. Eventually, birth rates decline to a level corresponding to death rates. The population stabilizes, but at a much higher level than that characteristic of patriarchal society. The described sequence of changes corresponds to the four stages of the demographic transition shown in Fig. VI-7.1. In the territory of the former Russian Empire and the USSR, the demographic transition occurred from 1885 to 1965. Overall, the demographic transition will be completed worldwide by 2050.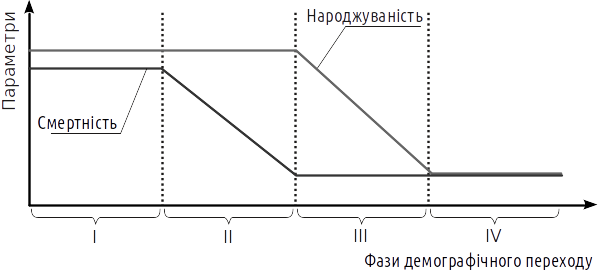
Fig. VI-7.1. Simplified version of the demographic transition scheme (changes in mortality and birth rates due to social "maturation" and the influence of modern technologies). Compare with Fig. VI-7.2!
Of course, the scheme shown in Fig. VI-7.1 is extremely simplified. The dynamics of each human population are influenced by other factors as well; even after the decline in mortality associated with the medical revolution, it does not remain unchanged. Nevertheless, the actual dynamics of mortality and birth rates in real human populations correspond to the demographic transition scheme (Fig. VI-7.2).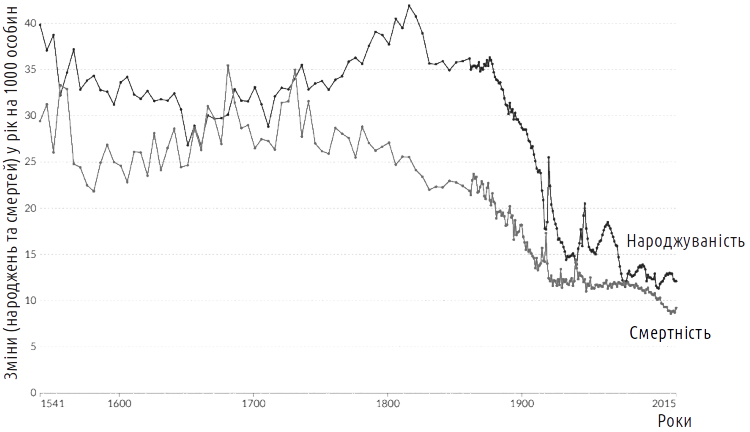
Fig. VI-7.2. Estimates of mortality and birth rates (per 1000 persons per year) for England and Wales (interval from 1541 to 2015). The dynamics of mortality and birth rates in general (excluding less significant trends) correspond to the scheme shown in Fig. VI-7.1. (source)
In Phase I of the demographic transition, corresponding to traditional societies, human populations are characterized by high mortality and high birth rates. Since the population grows in Phase I, the typical case can be considered when birth rates on average exceed mortality. Due to technological development, medical advances, and the benefits of civilization, mortality declines, primarily thanks to the reduction in infant mortality. This is Phase II of the demographic transition. Children survive more often, but the number of newborns remains unchanged, as it is determined by people's enduring notions of what a "proper" family should be.
Phase III of the demographic transition is characterized by declining birth rates. People have the opportunity to live for themselves, plan families... and realize that it is not at all necessary to have countless children. Birth rates sometimes decline to a level corresponding to mortality, and sometimes below it. Eventually, in Phase IV of the demographic transition, birth rates and mortality stabilize at a new level.
The events that follow one another during the demographic transition can be described as the "smelting" of the rural population into urban. In a peasant family, children are, to a significant extent, new labor. Older children help with agricultural work, middle ones care for the younger. Large families turn out to be more successful. In the urban environment, children begin earning late, most often after separating from their parents. Long childhood, school education, and often higher education require significant parental investment in each child. As a result, children become a burden. Even more important is the accessibility of education for women; the spread of feminist values leads to a change in life priorities for each particular woman; she begins to think not so much about conforming to traditional notions of her role ("Kinder, Küche, Kinderkirche," i.e., children, kitchen, church), but about her own development and career. Women increasingly begin to have children not when they are physiologically ready for it, but when they feel socially mature, ready for motherhood. The spread of contraceptives, birth planning technologies, allows one to begin sexual life long before the first pregnancy. Eventually, women begin having children later and have significantly fewer children. "Childfree" families or those who consciously limit themselves to a single child become widespread in cities (a phenomenon incredible for traditional agricultural society; there, childless or small families are almost always the result of illness).
Recently, when describing the demographic transition, a Phase V has been added to F. Notestein's scheme: the stage of new, "conscious" growth (Fig. VI-7.3). This corresponds only to a small extent to the current dynamics characteristic of the most developed countries, and is probably largely a nod to political correctness. Slow growth is the desired state of population for most countries, so the notion of how the transition should occur is being fitted to the desired answer ("the desired is taken for the real"). Alternative concepts propose considering the fifth phase as the phase of mortality prevalence and population decline.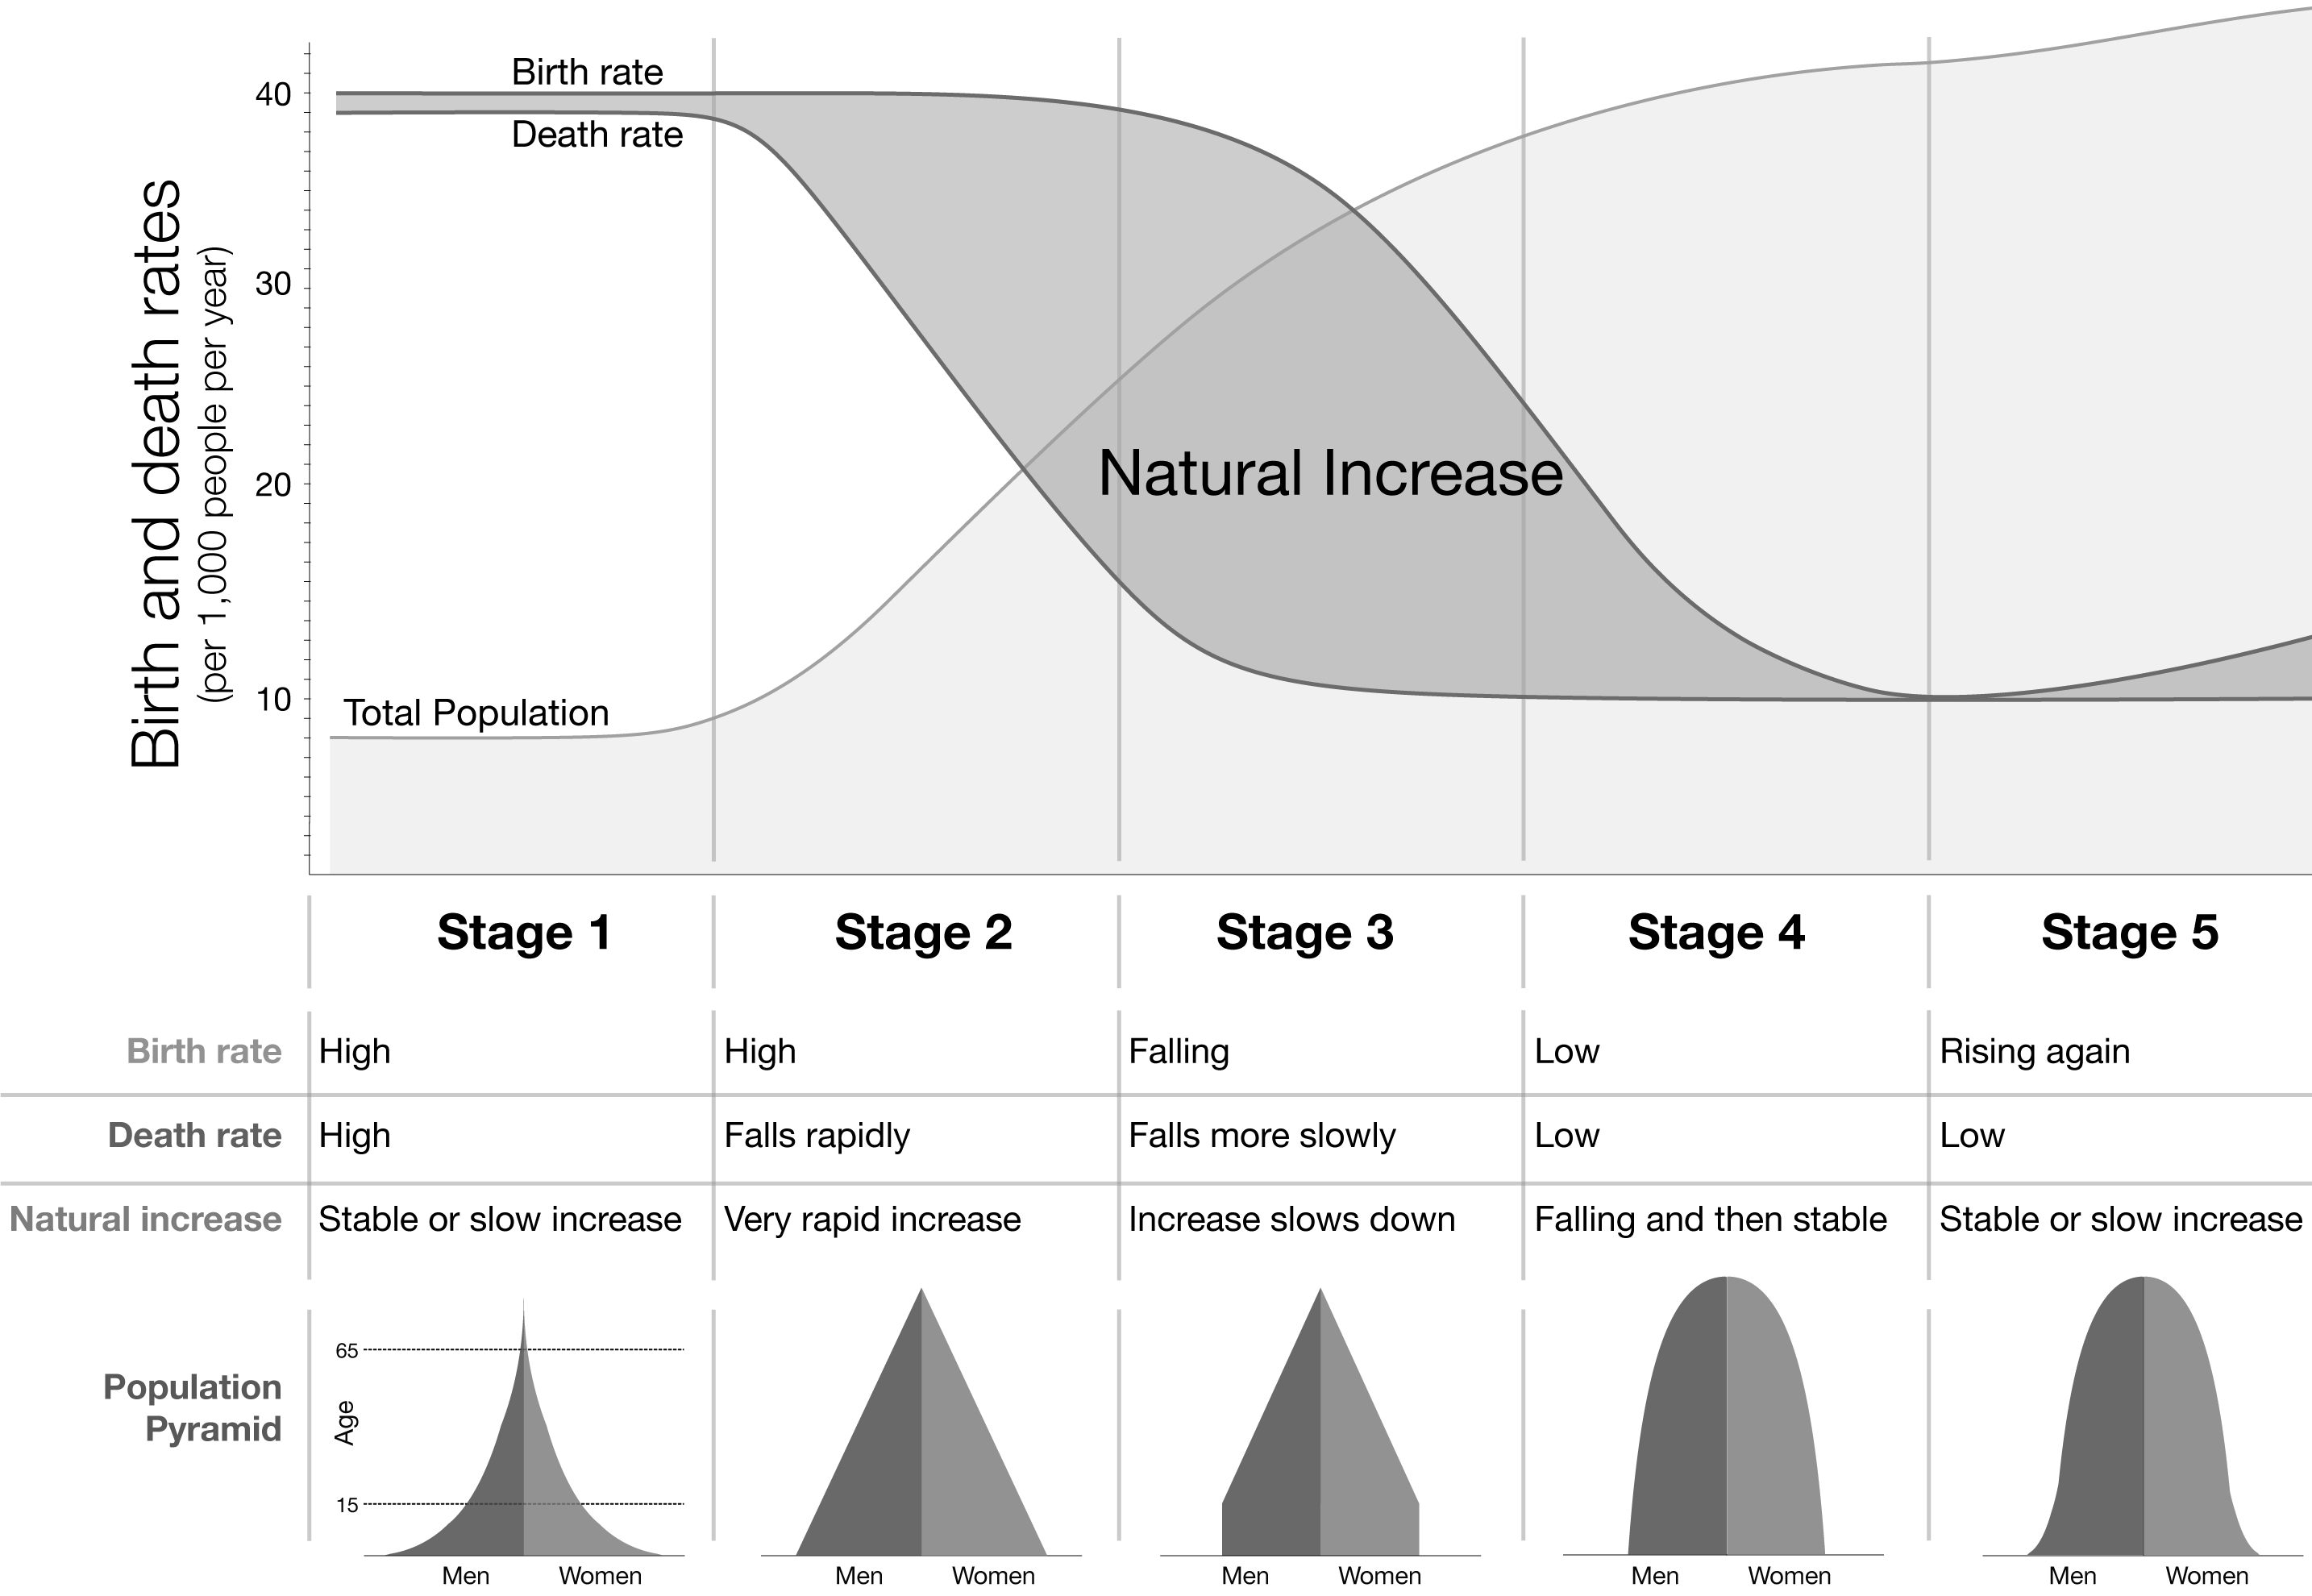
Fig. VI-7.3. The demographic transition scheme with five stages (en.wikipedia.org)
Despite the controversy over distinguishing Phase V of the demographic transition, Fig. VI-7.3 successfully demonstrates the connection between transition dynamics and demographic changes. Thus, in Phases II and III of the demographic transition, the population significantly "youngens"—a significant proportion consists of young people. Conversely, after reaching Phase IV of the demographic transition, the proportion of elderly people in society begins to grow rapidly.
Global humanity is distributed across the planet very unevenly. Population density is approximately shown in Fig. VI-7.4. The top 10 countries by population (as of 2020) are as follows: China (1.439 billion), India (1.380 billion), USA (331 million), Indonesia (274 million), Pakistan (221 million), Brazil (213 million), Nigeria (206 million), Bangladesh (165 million), Russia (146 million), and Mexico (129 million).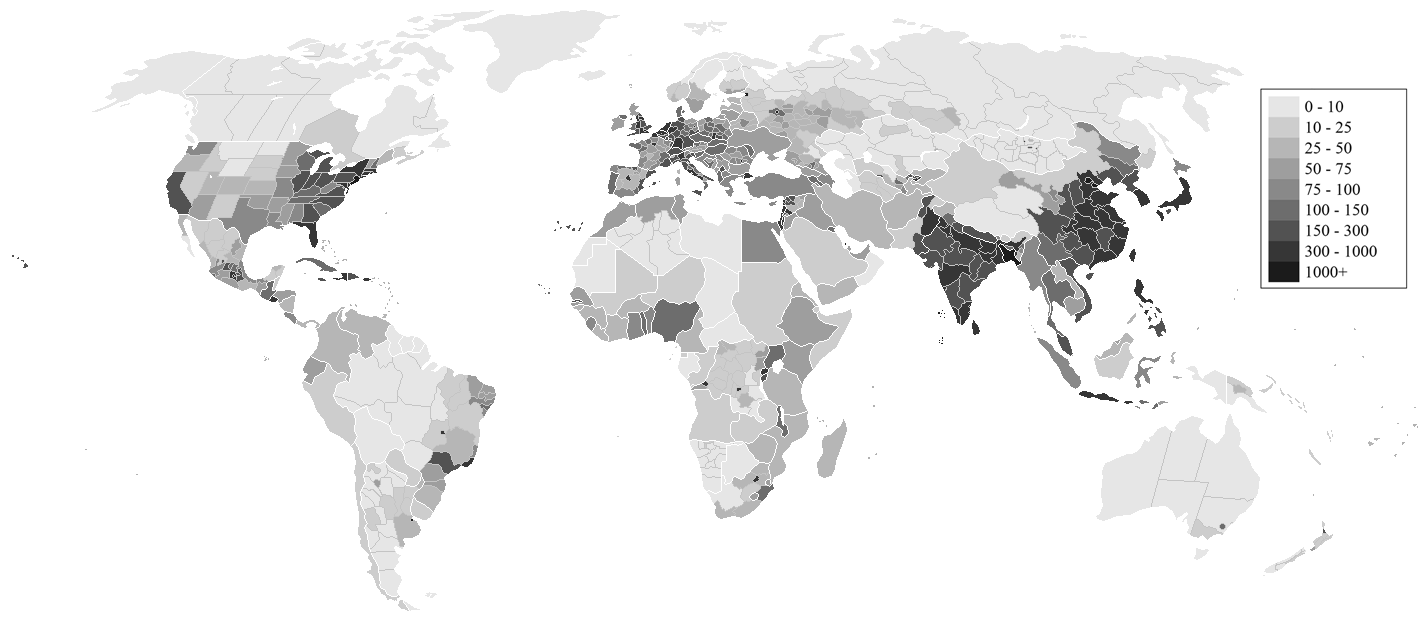
Fig. VI-7.4. Population density (according to English Wikipedia). The color scale, calibrated in number of people per square kilometer, is shown in the legend
The uneven distribution of humanity is also evident when comparing different countries (Table VI-7.1).
Table VI-7.1. Comparison of Demographic Indicators of Some Countries (according to Worldometers project for 2020)
|
|
Fig. 6.3.4. Population density (according to the English Wikipedia). The colour scale, calibrated in people per square kilometre, is shown in the inset. |
Table 6.3.1. Comparison of demographic indicators for selected countries (Worldometers project data, 2020) |
| Country | Population (million) | Annual growth | Population density (people/km²) | Area (thousand km²) | Migrants (million/year) | Avg. children per woman | Median age (years) | Urban population % | |
| China | 1439 | 0.39 % | 153 | 9388 | –0.349 | 1.69 | 38 | 61 % | |
Population Density, |
| Bangladesh | 165 | 1.01 % | 1265 | 130 | –0.370 | 2.05 | 28 | 39 % | |
| Japan | 126 | –0.30 % | 347 | 364 | 0.071 | 1.4 | 48 | 92 % | |
| Ukraine | 44 | –0.59 % | 75 | 579 | 0.010 | 1.4 | 41 | 69 % | |
|
| Somalia | 16 | 2.92 % | 25 | 627 | –0.040 | 6.1 | 17 | 47 % | |
1439 |
0,39% |
153 |
9388 |
-0,349 |
1,69 |
38 |
61% |
|
|
1380 |
0,99% |
464 |
2973 |
-0,533 |
2,24 |
28 |
35% |
|
The leading aid concept adopted now by Western countries is “appropriate technology.” Its components are: |
331 |
0,59% |
36 |
9147 |
0,955 |
1,78 |
38 |
83% |
|
0.955 |
206 |
0,72 |
226 |
910 |
-0,060 |
5,4 |
18 |
52% |
|
-0.060 |
165 |
1,01% |
1265 |
130 |
-0,370 |
2,05 |
28 |
39% |
|
-0.370 |
146 |
0,04% |
9 |
16377 |
0,182 |
1,82 |
40 |
74% |
|
0.182 |
126 |
-0,30% |
347 |
364 |
0,071 |
1,4 |
48 |
92% |
|
0.071 |
84 |
0,32% |
240 |
349 |
0,544 |
1,6 |
46 |
76% |
|
Ukraine |
44 |
-0,59% |
75 |
579 |
0,010 |
1,4 |
41 |
69% |
|
0.010 |
38 |
-0,11% |
124 |
306 |
-0,029 |
1,4 |
42 |
60% |
|
-0.029 |
16 |
2,92% |
25 |
627 |
-0,040 |
6,1 |
17 |
47% |
|
-0.040 |
9,4 |
-0,03% |
47 |
203 |
0,008 |
1,7 |
40 |
79% |
|
0.008 |
8,6 |
1,60% |
400 |
21 |
0,010 |
3,0 |
30 |
93% |
|
0.010 |
5,8 |
0,79% |
8 |
725 |
0,027 |
1,2 |
42 |
|
|
725 |
5,5 |
0,15% |
18 |
303 |
0,014 |
1,5 |
43 |
86% |
VI-7. Demographic Transition
What accounts for the population growth discussed in the previous section? It might seem to some that it is due to higher birth rates: if there are more people, then more are being born. Surprisingly, the situation is the opposite: the population growth is associated with a change in the nature of mortality. Of course, everyone born into the world will eventually die, but for population dynamics, it matters greatly when this occurs. The "surge" in human numbers at the end of the 20th century is related to the shift from pre-reproductive (before reproductive age) mortality to post-reproductive (after leaving descendants). In other words, if a century ago most newborns died in the first days and months of life, in recent decades most of them have survived to reproductive age and left some offspring. The change in the ratio of births to deaths, accompanied by rapid population growth and then its stabilization, is called the demographic transition. The author of this concept is American demographer Frank Notestein, who in 1945 summarized both his own results and the achievements of his predecessors.
To understand why the population grows, one must determine under what conditions it remains constant. The population does not change if each subsequent generation is the same size as the previous one. This is possible if, on average, each mature woman has one daughter who survives to maturity (or, given equal sex ratios, each pair of parents has two children who survive to maturity). If all newborns survived to adulthood and then had children, two children per couple would be sufficient. Since at least a small portion of people will never reach reproductive age, and some definite portion will not have children, even in a society with very low pre-reproductive mortality, slightly more than two children per couple are needed to maintain a constant population. In a society with inadequate medical development and high infant mortality, even to maintain a constant population, each couple must have many children. Under conditions where only one in five newborns survives to reproductive age, a constant population corresponds to more than 10 births per couple (and per woman). However strange such a number of children may seem to modern humans, it is normal for our species! Just a century ago, it was entirely typical.
Medical advances led to a sharp decrease in infant mortality—first in developed countries and then in developing ones. Fortunately, infant mortality is declining sharply, but this has almost no effect on birth rates. People born into large families themselves have many children. Birth rates significantly exceed death rates, and the population is growing rapidly. Technological progress allows feeding a much larger population.
In the pre-industrial era, the majority of the population lived in villages. With population growth, there was not enough land for everyone, many peasant children left for cities and began living new lives. The break with traditional values and peasant culture leads people to have relatively few children. Eventually, birth rates decline to a level corresponding to death rates. The population stabilizes, but at a much higher level than that characteristic of patriarchal society. The described sequence of changes corresponds to the four stages of the demographic transition shown in Fig. VI-7.1. In the territory of the former Russian Empire and the USSR, the demographic transition occurred from 1885 to 1965. Overall, the demographic transition will be completed worldwide by 2050.
Fig. VI-7.1. Simplified version of the demographic transition scheme (changes in mortality and birth rates due to social "maturation" and the influence of modern technologies). Compare with Fig. VI-7.2!
Of course, the scheme shown in Fig. VI-7.1 is extremely simplified. The dynamics of each human population are influenced by other factors as well; even after the decline in mortality associated with the medical revolution, it does not remain unchanged. Nevertheless, the actual dynamics of mortality and birth rates in real human populations correspond to the demographic transition scheme (Fig. VI-7.2).
Fig. VI-7.2. Estimates of mortality and birth rates (per 1000 persons per year) for England and Wales (interval from 1541 to 2015). The dynamics of mortality and birth rates in general (excluding less significant trends) correspond to the scheme shown in Fig. VI-7.1. (source)
In Phase I of the demographic transition, corresponding to traditional societies, human populations are characterized by high mortality and high birth rates. Since the population grows in Phase I, the typical case can be considered when birth rates on average exceed mortality. Due to technological development, medical advances, and the benefits of civilization, mortality declines, primarily thanks to the reduction in infant mortality. This is Phase II of the demographic transition. Children survive more often, but the number of newborns remains unchanged, as it is determined by people's enduring notions of what a "proper" family should be.
Phase III of the demographic transition is characterized by declining birth rates. People have the opportunity to live for themselves, plan families... and realize that it is not at all necessary to have countless children. Birth rates sometimes decline to a level corresponding to mortality, and sometimes below it. Eventually, in Phase IV of the demographic transition, birth rates and mortality stabilize at a new level.
The events that follow one another during the demographic transition can be described as the "smelting" of the rural population into urban. In a peasant family, children are, to a significant extent, new labor. Older children help with agricultural work, middle ones care for the younger. Large families turn out to be more successful. In the urban environment, children begin earning late, most often after separating from their parents. Long childhood, school education, and often higher education require significant parental investment in each child. As a result, children become a burden. Even more important is the accessibility of education for women; the spread of feminist values leads to a change in life priorities for each particular woman; she begins to think not so much about conforming to traditional notions of her role ("Kinder, Küche, Kinderkirche," i.e., children, kitchen, church), but about her own development and career. Women increasingly begin to have children not when they are physiologically ready for it, but when they feel socially mature, ready for motherhood. The spread of contraceptives, birth planning technologies, allows one to begin sexual life long before the first pregnancy. Eventually, women begin having children later and have significantly fewer children. "Childfree" families or those who consciously limit themselves to a single child become widespread in cities (a phenomenon incredible for traditional agricultural society; there, childless or small families are almost always the result of illness).
Recently, when describing the demographic transition, a Phase V has been added to F. Notestein's scheme: the stage of new, "conscious" growth (Fig. VI-7.3). This corresponds only to a small extent to the current dynamics characteristic of the most developed countries, and is probably largely a nod to political correctness. Slow growth is the desired state of population for most countries, so the notion of how the transition should occur is being fitted to the desired answer ("the desired is taken for the real"). Alternative concepts propose considering the fifth phase as the phase of mortality prevalence and population decline.
Fig. VI-7.3. The demographic transition scheme with five stages (en.wikipedia.org)
Despite the controversy over distinguishing Phase V of the demographic transition, Fig. VI-7.3 successfully demonstrates the connection between transition dynamics and demographic changes. Thus, in Phases II and III of the demographic transition, the population significantly "youngens"—a significant proportion consists of young people. Conversely, after reaching Phase IV of the demographic transition, the proportion of elderly people in society begins to grow rapidly.
Global humanity is distributed across the planet very unevenly. Population density is approximately shown in Fig. VI-7.4. The top 10 countries by population (as of 2020) are as follows: China (1.439 billion), India (1.380 billion), USA (331 million), Indonesia (274 million), Pakistan (221 million), Brazil (213 million), Nigeria (206 million), Bangladesh (165 million), Russia (146 million), and Mexico (129 million).
Fig. VI-7.4. Population density (according to English Wikipedia). The color scale, calibrated in number of people per square kilometer, is shown in the legend
The uneven distribution of humanity is also evident when comparing different countries (Table VI-7.1).
Table VI-7.1. Comparison of Demographic Indicators of Some Countries (according to Worldometers project for 2020)
Area,
thousand km2.
Average Number of Offspring
per Woman
Average Age,
years
Urban Population
Share
Data in tabular form is not very easy to perceive, but Table VI-7.1 provides excellent opportunities for comparing our country with others and understanding our characteristics. In terms of population decline (despite the arrival of migrants), our country is one of the world leaders. Unfortunately, this is connected not so much with a high level of our development, but with the perception of the situation by our citizens. A decline in living standards, abandonment of previously set goals, can lead to a depressive outlook. Since Ukraine is one of the priority targets for the most powerful "brainwashing" systems in the world, a catastrophic perception of reality is very characteristic of the average person who forms their own judgment about the world based on what is told about this world on television.
From an economic perspective, countries are conventionally divided into developed and developing. This division is quite arbitrary; there are no clear criteria for distinguishing such countries.
"A developed country is one that enables all its inhabitants to enjoy free and healthy life in a safe environment." Kofi Annan.
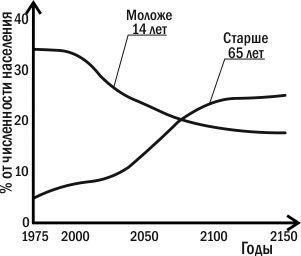
Now many developing countries have powerful and dynamic economies, and the most characteristic features of countries in this group are the characteristics of their populations. Developed countries have stable or declining populations with a significant proportion of elderly people (Fig. VI-7.5). The populations of developing countries remain young and are growing rapidly (Fig. VI-7.6).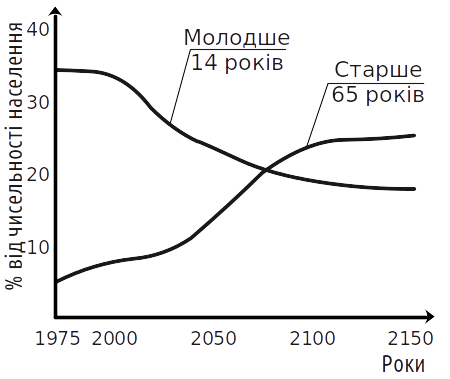
Fig. VI-7.5. Change in the share of young and elderly people on average for all of humanity. Future data correspond to UN forecasts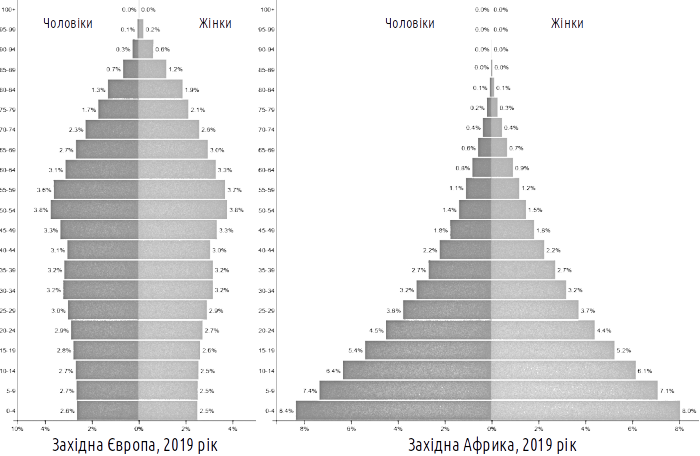
Fig. VI-7.6. Demographic pyramids characteristic of developed and developing countries (source)
The technologies that ensured the current growth of humanity were developed in developed countries. The success of these countries is a consequence of implementing such technologies that relate to healthcare, industry, and agriculture. After modern technologies transformed developed countries, these technologies were exported to developing countries, causing significant growth in their populations.
The difference in population dynamics only increases the global economic disproportionality: the overwhelming majority of economic assets belongs to developed countries; these countries consume the overwhelming share of resources used by humanity. Of course, such disproportionality leads to increasing tension between poor and rich countries. So far, developed countries, thanks to significant military superiority, can maintain their status. However, this situation may change in the future. The share of developed countries in the total population of the planet will continue to decrease. The nature of modern conflicts is changing. The confrontation of regular armies is becoming less important, and the ability to inflict quick and sensitive blows on the enemy is becoming increasingly significant. Such blows can be delivered both through high-precision weapons and through terrorist groups.
Could this mean that the increased level of aggressiveness between different groups of humanity will slow its growth? No. At the current stage, in developing countries with their numerous young populations, catastrophes and wars very weakly affect population growth! Currently, 3-6 million people die annually from hunger and malnutrition, but these losses are compensated through births within a few days.
"Social and cultural factors more than anything else determine birth rates. The most important of these is the role that women play in the family, economy, and society as a whole. Fertility rates decline as women's opportunities for employment outside the home and farm expand, as their access to education increases and the marriage age rises.... Poverty breeds high population growth rates. Low-income families with inadequate social security need children first to involve them in work, and then so they can feed their parents" (Report of the International UN Commission on Environment and Development, 1987).
Inequality in food production can be partially compensated through its redistribution, for example in the form of so-called humanitarian aid that rich countries transfer to poor ones. However, in the course of providing humanitarian aid, new problems may arise. One of them has been called the "very sad theorem." Humanitarian aid (cheap food surpluses) arriving from developed countries to the hungry leads to short-term alleviation of hunger and long-term aggravation of it due to the destruction of local producers.
The leading concept of aid currently adopted by Western countries is "appropriate technology." The components of this concept are:
— Direct satisfaction of population needs without destroying existing social structure;
— Undemanding in terms of education and skill level; emphasis on methods that citizens can teach each other;
— Use of numerous and cheap local resources;
— Reliance on existing material support and small producers.
While allowing the most acute problems to be solved, such aid preserves the differences between developed and developing countries. A natural reaction of citizens of developing countries to such aid is the fear that they are being locked into the past. On the other hand, in the long term, it may turn out that the economy of developed countries, based on the use of colossal amounts of fossil energy, will prove to be more sensitive to inevitable restructurings than the relatively primitive economy of backward countries.