
Ecology: The Biology of Interactions. VI-06. The Demographic Explosion
One of the founders of cybernetics, Heinz von Foerster, reported the hyperbolic growth of humanity in a paradoxical form, publishing (together with his colleagues) a 1960 article titled "Doomsday: Friday, 13 November, A.D. 2026." According to the data available to von ...
VI-6. The demographic explosion
Were you surprised that we named the growth in human numbers as the main cause of today's ecological crisis? First of all, we should look at how exactly this growth took place. Different sources give different estimates, but the general character of the growth in human numbers is beyond doubt.
When our species arose in Africa, its numbers could not have exceeded a few hundred thousand individuals, and at certain intervals, as we have already noted, they fell to just a few dozen individuals. Having spread across Eurasia, populations of our species reached numbers in the millions, passed through the crisis of the Neolithic Revolution, and began to grow steadily (Table VI-6.1). This growth was significantly braked only during the epidemics of the "Black Death" in medieval Europe, where a substantial fraction of all humanity lived at the time. As you can see, this growth was accelerating. It is precisely this avalanche-like acceleration in the growth of human numbers that justifies calling it a demographic explosion.
Table VI-6.1. Growth in human numbers (N)
|
Year |
N, million |
Year |
N, million |
Year |
N, million |
Year |
N, million |
|||
|
-10000 |
4 |
1900 |
1600 |
1973 |
3928 |
1997 |
5905 |
|||
|
-5000 |
5 |
1927 |
2000 |
1974 |
4004 |
1998 |
5985 |
|||
|
-4000 |
7 |
1951 |
2584 |
1975 |
4079 |
1999 |
6064 |
|||
|
-3000 |
14 |
1952 |
2631 |
1976 |
4155 |
2000 |
6143 |
|||
|
-2000 |
27 |
1953 |
2678 |
1977 |
4230 |
2001 |
6223 |
|||
|
-1000 |
50 |
1954 |
2725 |
1978 |
4305 |
2002 |
6302 |
|||
|
-500 |
100 |
1955 |
2773 |
1979 |
4381 |
2003 |
6381 |
|||
|
-200 |
150 |
1956 |
2822 |
1980 |
4458 |
2004 |
6461 |
|||
|
0 |
170 |
1957 |
2873 |
1981 |
4537 |
2005 |
6542 |
|||
|
200 |
190 |
1958 |
2926 |
1982 |
4617 |
2006 |
6624 |
|||
|
600 |
200 |
1959 |
2980 |
1983 |
4700 |
2007 |
6706 |
|||
|
700 |
210 |
1960 |
3035 |
1984 |
4784 |
2008 |
6789 |
|||
|
800 |
220 |
1961 |
3092 |
1985 |
4871 |
2009 |
6873 |
|||
|
900 |
240 |
1962 |
3150 |
1986 |
4961 |
2010 |
6957 |
|||
|
1000 |
275 |
1963 |
3211 |
1987 |
5053 |
2011 |
7041 |
|||
|
1100 |
320 |
1964 |
3274 |
1988 |
5145 |
2012 |
7126 |
|||
|
1200 |
350 |
1965 |
3340 |
1989 |
5237 |
2013 |
7211 |
|||
|
1400 |
360 |
1966 |
3408 |
1990 |
5327 |
2014 |
7295 |
|||
|
1500 |
450 |
1967 |
3479 |
1991 |
5414 |
2015 |
7380 |
|||
|
1600 |
500 |
1968 |
3552 |
1992 |
5499 |
2016 |
7464 |
|||
|
1700 |
610 |
1969 |
3626 |
1993 |
5582 |
2017 |
7548 |
|||
|
1760 |
770 |
1970 |
3700 |
1994 |
5663 |
2018 |
7631 |
|||
|
1804 |
1000 |
1971 |
3776 |
1995 |
5744 |
2019 |
7713 |
|||
|
1850 |
1200 |
1972 |
3852 |
1996 |
5825 |
2020 |
7795 |
An interesting way to take in the size of humanity at a single glance is offered on the website of the Worldometers project. There you can see the number of figures corresponding to the size of humanity (you can scroll the page sideways and down) and watch new ones being added to those already there. Each of us is one figure on that sheet.
The dynamics shown in Table VI-6.1 are not hard to visualize on a graph. The result is shown in Fig. VI-6.1.
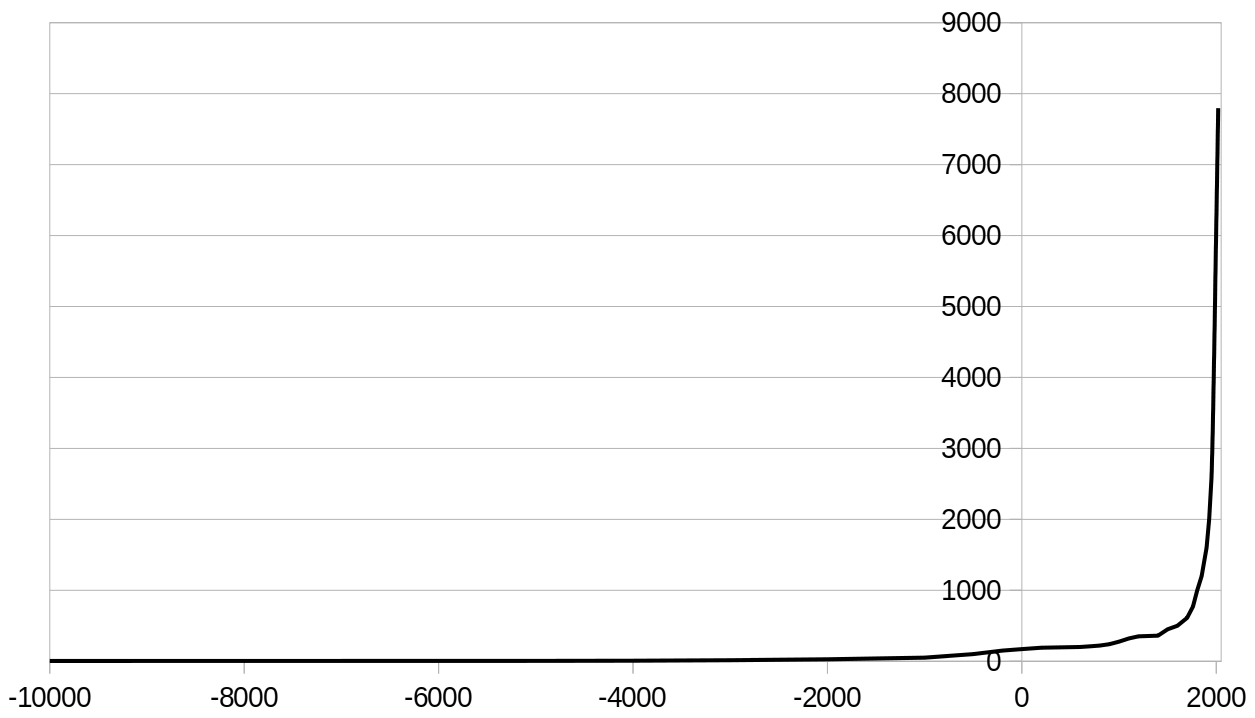
Fig. VI-6.1. Dynamics of the growth of humanity's numbers
The growth shown in Fig. VI-6.1 differs from exponential growth (Fig. VI-6.2)! Modelling the growth of humanity shows that its increase is proportional not to the number of individuals, as in the exponential model, but to the square of that number. A doubling of humanity's numbers corresponds to a fourfold increase in the rate of its growth! Such growth is called hyperbolic. Population increase under the hyperbolic model is described by the equation dN/dt = N2/C, where C — is a constant (compare this formula with the exponential equation!).
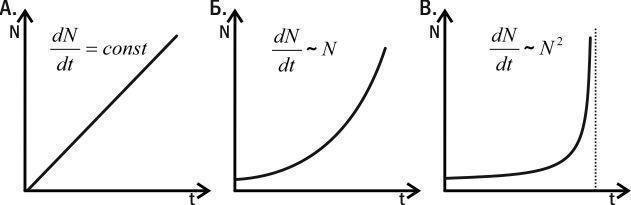
Fig. VI-6.2. Linear (A), exponential (B), and hyperbolic (C) growth
One of the founders of cybernetics, Heinz von Foerster, reported on the hyperbolic growth of humanity in a paradoxical form, publishing (together with his colleagues) in 1960 an article titled "Doomsday: Friday, 13 November, A.D. 2026." According to the data available to von Foerster, if the population of humanity had continued to grow at the same rate as before, on that day it would have reached infinity! Naturally, this is impossible. It follows that some fundamental changes should be expected that would halt the growth of humanity's numbers. It remains to understand what those changes would be.
Heinz von Foerster and his colleagues managed to show that the change in humanity's numbers (over the interval from year 1 of our era to 1958) is astonishingly precisely described by an unexpectedly simple formula: Nt=C/(t0–t), where Nt — is the size of humanity at time t, and C and t0 — are constants. The value t0 can be interpreted as the moment when humanity's numbers reach infinity. In von Foerster's calculations it turned out to equal 2026.87, which corresponds to 13 November 2026. As it happens, that day turned out to be not just the thirteenth of the month, but also a Friday, and moreover, von Foerster's own birthday! The denominator of the fraction, the expression t0–t, simply denotes the number of years remaining until the "end of the world." Substituting the relevant coefficients, von Foerster's equation takes the approximate form Nt=215 000/(2027–t).
After the work of von Foerster and his co-authors, their conclusions were repeatedly checked and confirmed. The growth described by this equation continued until the 1970s (after which humanity began to "fall behind" (Fig. VI-6.3). Humanity's fastest growth was in 1968 and 1969 — at 102.09% annually. Currently humanity grows at 101.05% per year.
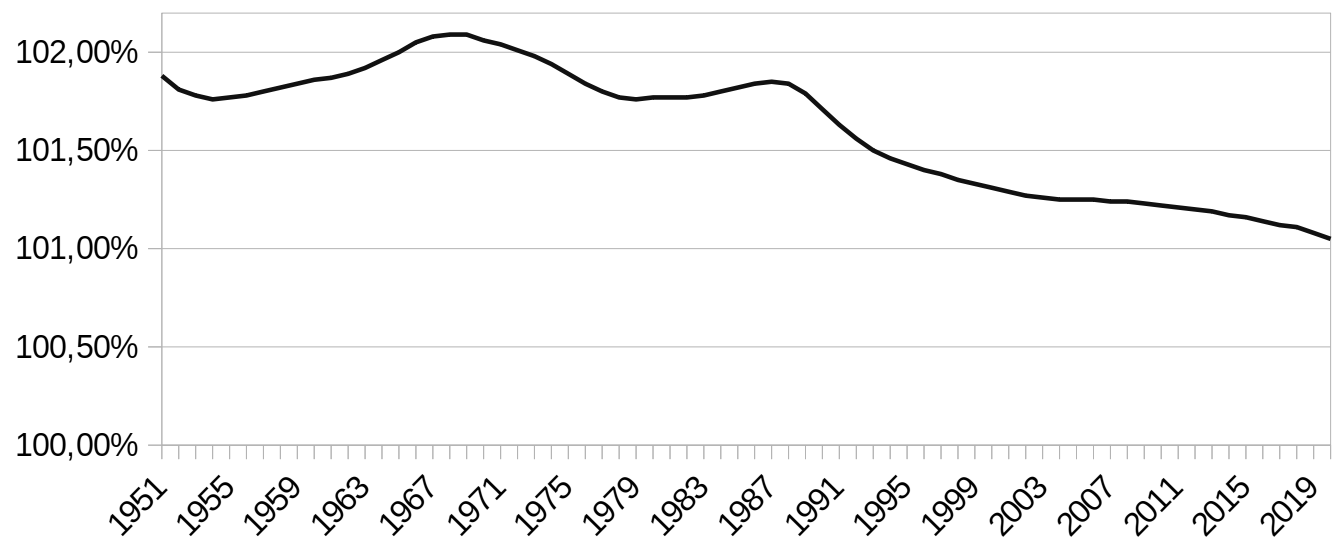
Fig. VI-6.3. Annual growth of humanity's numbers (as a % of the previous year's number)
Further research has shown that the hyperbolic equation began to "work" with decent accuracy in describing humanity's numbers as far back as several million years before our era — that is, even before the appearance of the species Homo sapiens! Naturally, we have no precise data on the population of the planet for any period of its history whatsoever. Even now, in an era of comprehensive population censuses, data on Earth's population are fairly approximate. And, for example, the population of the Earth when it was inhabited by Homo erectus must be estimated from indirect data. However, we should not demand absolute precision from von Foerster's equation, as from any model. It does allow us to obtain an estimate that agrees reasonably well with the available data. The hyperbolic relationship can be applied only to the numbers of humanity as a whole, not to the population of individual countries. This suggests that the hyperbolic relationship applies to a property of humanity as a single, unified whole.
Notice the fluctuations in the curve of humanity's growth that occurred during our era (Fig. VI-6.1). As already mentioned, the strongest influence on it was the "Black Death" epidemic in Europe; smaller fluctuations were associated with less large-scale catastrophes: wars and natural anomalies. How did global humanity respond to these catastrophes? To better understand the result obtained from studying the historical data, let us examine it using a hypothetical example (Fig. VI-6.4).
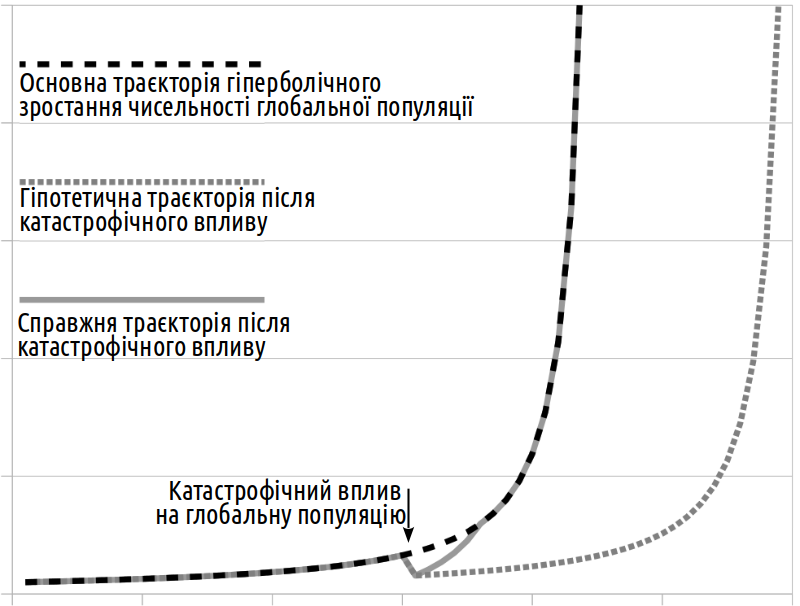
Fig. VI-6.4. The effect of catastrophes on the hyperbolic growth of global humanity (a hypothetical example corresponding to real data)
As already mentioned, hyperbolic growth became characteristic of humanity long before historical times. Long before the demographic explosion occurred, the growth of humanity reflected a mathematical relationship that determined the time at which this explosion could be expected. Let us consider how a catastrophe like the "Black Death" (shown by the arrow in Fig. VI-6.4) might have affected this growth. This catastrophe reduces humanity's numbers to a level that had been characteristic of it some time earlier. If the growth in humanity's numbers were determined by its reproductive capacity, this would have led to the demographic explosion occurring at a later time (such a hypothetical curve is shown in Fig. VI-6.4 as a grey dashed line). However, real humanity behaved differently (the solid grey line in the figure). Its growth accelerated, and in a short time it returned to the very same trajectory along which it had been developing before the catastrophe. (Dear reader: if you have not felt surprise, you have not understood the last point; reread this paragraph again, grasp the paradox it describes, and be amazed!).
To understand this result, let us consider how a population growing according to the logistic model responds to a decline in numbers. As you recall (see Fig. IV-15.2), logistic growth can be divided into two phases: the r-phase and the K-phase. In the r-phase, population growth is influenced more by the population's reproductive capacity, while in the K-phase it is influenced more by the amount of available resources. We can verify that in the r- and K-phases the population responds differently to a decline in numbers caused by some impact (Fig. VI-6.5).
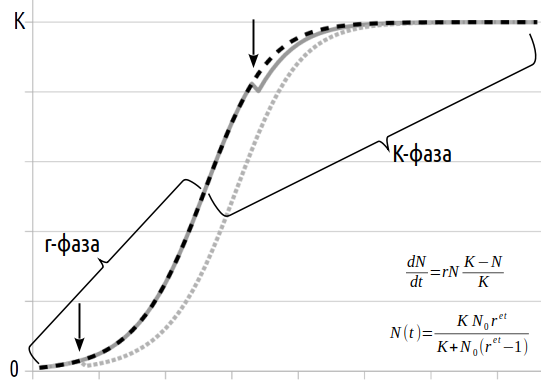
Fig. VI-6.5. The effect of catastrophes on the numbers of a population growing according to the logistic model
A decline in population numbers in the r-phase, as it were, turns the population growing according to the logistic model back to the past (that is, to a stage with smaller numbers). The response to the decline in numbers is a slowdown in growth (since growth depends primarily on the number of potential parents, and there are now fewer of them). In the K-phase, by contrast, the response to a decline in numbers is an acceleration of growth (since growth depends primarily on the amount of free resources, and their amount increases when numbers decline). However, even in the K-phase, a decline in numbers leads to some "lag" of the population behind the originally expected trajectory; the level K will be reached with a certain delay.
How does the response of the population shown in Fig. VI-6.5 to an impact inflicted during the K-phase differ from the response of global humanity shown in Fig. VI-6.4? Global humanity returns to the very same curve along which it had been developing before. How can this be explained? The logistic model sets a level K; after an impact, the population returns to it. The hyperbolic equation also sets an upper bound on humanity's numbers, only this bound grows at an accelerating rate! Most likely, humanity's reproductive capacity has at all times remained in excess and has been held in check by mortality. However, the maximum number, near which mortality rose sharply, has become ever higher over time. Whenever humanity's numbers lagged behind this rising ceiling, it quickly caught up with that ceiling, that is, it returned to the original curve of its dynamics.
So, the hyperbolic relationship describes precisely the change in the carrying capacity of the environment! What is this connected with? The fact is that human beings, unlike any other species of animal or indeed any other living organism, are capable of rapidly changing their way of life. The modern character of humanity's interaction with the environment differs fundamentally from what was characteristic of it a few centuries ago, and even more so from what was characteristic several millennia or several million years ago. It is precisely this circumstance that gives hope for an explanation of hyperbolic growth. It is likely (although this problem cannot yet be considered finally resolved) that the explanation for this feature of humanity's population growth is as follows. The more people live on Earth, the more intensively technological progress proceeds, the wider our species' ecological niche becomes and the greater the carrying capacity available to it becomes, the faster humanity's numbers grow, the more potential inventors appear within it, and the faster technological progress proceeds...
"The result is a system of positive feedback loops that spins up the flywheel of hyperbolic growth in the world's population: technological growth — growth of the upper limit of the Earth's carrying capacity — demographic growth — more potential inventors — acceleration of technological growth — accelerated growth of the Earth's carrying capacity — even faster demographic growth — accelerated growth in the number of potential inventors — even faster technological growth — further acceleration of the growth of the Earth's carrying capacity, and so on" (A.V. Markov, A.V. Korotayev, 2011).
We know that no population is capable of accelerating growth indefinitely — sooner or later its growth will give way either to a slowdown or to a catastrophe. The growth of humanity, too, must inevitably come to a stop.
"...for nearly its entire history, humanity found itself in the so-called Malthusian trap: all technological gains, as well as gains in food production, were nullified by population growth. As soon as harvests improved, the birth rate immediately rose, and a surplus of extra mouths appeared. After a brief period of plenty, human society again found itself on the brink of famine and poverty. Such periodic crises were very characteristic of agrarian societies. <...> A period eventually arrived when population growth stopped keeping pace with technological growth and began noticeably lagging behind it. Thus a way out of the Malthusian trap emerged for humanity, although today one can speak of its complete overcoming only with respect to the most developed countries". (A.V. Markov, A.V. Korotayev, 2011).
On Earth, not only the size of the population is growing, but also the standard of living and the level of industry. Later research showed that if von Foerster and his colleagues had had data on the growth of world gross domestic product (GDP) for the period from year 1 of our era to 1973, they would also have been able to calculate the date of the economic "end of the world." As difficult as it may be to compare the production of dried dates in Ancient Rome with the output of aircraft in the modern world, some comparative estimate of the volumes of these forms of production is possible. GDP grows even faster than population — following a quadratic-hyperbolic relationship. According to the quadratic-hyperbolic model, humanity's GDP should have become infinitely large on Saturday, 23 July 2005. Did you notice anything on that day? This means that the relationships which had governed the growth of the world economy throughout its entire history ceased to operate. This happened during the lifetime of a substantial portion of today's population of the Earth. Note that the "break" affected both the economy and the growth of population, both of which are now changing with an ever-increasing lag behind the models we have described.
Incidentally, in keeping with the meanings of the terms "crisis," "catastrophe," and "collapse" that we discussed at the start of this section, the crisis has ALREADY turned into a catastrophe — a restructuring of the functioning of the system. Now the task before us is to prevent the catastrophe from turning into a collapse.
So, the break in the growth of humanity's numbers occurred in the 1970s of the twentieth century. It was then that humanity fell behind the pace of growth "proposed" by the hyperbolic growth equation, and entered the demographic transition (see section VI-3). Roughly speaking, up to the 1970s the population grew by 2% per year; now it grows by a bit more than 1% (the peak has been passed). Before humanity's growth began to slow, food production grew by 2.3% per year, and now it stands at less than 2%. But the biosphere must pay a very serious price for this growth. Under present-day technology, a two-percent increase in food production is achieved through a 5% increase in energy consumption, a 7% increase in water consumption, a 7% increase in fertilizer production, and a 10% increase in pesticide production. It is likely that in the twenty-first century the population will increase by less than double, while resource and energy consumption will increase five- to sixfold. However, the main problem facing present-day humanity does not even lie here. It lives thanks to the use of fossil-fuel energy, which will inevitably run out. What will happen once fossil fuel runs out, and it becomes impossible to further increase the load on ecosystems?
One version of the answer to this question assumes that humanity "will think of something," as it has done so far. Unfortunately, there is still no reason to hope that humanity will be able to maintain the necessary quality of environment through its technologies. The largest-scale experiment of this kind was carried out in the late twentieth century in Arizona. There, "Biosphere 2" was created (the experiment's organizers considered Earth's own biosphere to be "Biosphere 1"). On a site of 1.3 hectares, an isolated dome was erected containing various elements of ecosystems, intended to sustain the life of 8 human volunteers. In 1991, the shell of "Biosphere 2" was sealed. After 15 months, the airtightness of the shell had to be broken, and the volunteers rescued, since the intensity of photosynthesis and the amount of oxygen in the artificial biosphere had fallen below a critical level. Of the 25 species of vertebrates placed under the dome, 18 went extinct; all pollinating insects died out; the "natural" purification of water and air broke down. The main outcome of the experiment was the recognition that we are unaware of many of the details of the mechanism that ensures the stable existence of ecosystems. Instead of the expansion of environmental carrying capacity characteristic of "Biosphere 1," in "Biosphere 2" the carrying capacity of the environment collapsed catastrophically.